Unless you’ve been living with your head under a rock for the last 4 years, you will definitely have heard of Bitcoin. You would also have heard about the technology behind Bitcoin, Blockchain. Now cryptocurrencies are banned in most cases in India and China, but the Americas and Europe still use cryptocurrencies extensively. And in my opinion, Asia stands to lose a lot if blockchain is not adopted extensively everywhere. Because make no mistake about it – blockchain technology will change the world as we know it. Forever.
Blockchain is the technology powering Bitcoin and other cryptocurrencies. To explain what blockchain is and what bitcoin is you can go through anyone of the articles below. Don’t worry these articles are carefully selected to be as interesting and fun to read as possible. (This also gives me space to add my own original ideas instead of copying or rewording existing articles – and I have plenty (of ideas)!
In fact, that last link is so amazingly simple visual and clear that I recommend everyone read it. Just so that we’re on the same page.
Exciting Applications
From Pixabay
Cut to the chase. A little confession here. I was asked to do this article nearly 16 days ago. Now I have some experience with blockchain before since having gone through it extensively as a research topic for my own blog. Then a remarkable idea hit me. An idea for a startup that could (in theory) become a multi-billion dollar enterprise. I spent a few days refining it, even going so far as to see if I could start this company with this area myself, until reality set in – I lacked the experience and the business skills.
No sooner had this realization struck me and the excitement cooled a little, another idea to improve blockchain struck me, and I promise to sketch out that idea as well. I am doing this for two reasons:
I am staunch support of the FOSS (free open source software movement and would like to be credited with the idea, and I am starting a free to use, open source project on GitHub – working on it, currently moving towards an alpha release as of now.
I believe in the power of technology to remove economic inequality. Now you may say that technology has evolved to the point that 4-5 monolithic companies dominate the entire world. But I believe that technology when used ethically has the potential to create more opportunities than it removes.
Blockchain has two major problems – energy consumption and resource consumption. But there are techniques that can alleviate both of these problems. We’ll deal with that as well in Part 2.
Finally, the vaunted hype about security for blockchain and cryptocurrencies is ridiculous when you think about it. For the sake of brevity, I will address the main security issues with blockchain in a separate article on Medium – (not here, since it has no relation to data science).
Application – A Personal Blockchain For Every Person On The Planet
In points (I assume you’ve gone through the graphical explanation of blockchain at least – if not you can review it here):
The trouble with end products of all types that are produced today is that there are so many intermediaries between the producer and the consumer that the producers receives a pittance compared to the end final price. It would be nice if we could track a product everywhere that it is used.
This is also applicable for books, music, articles, poems, pictures, any digital content of any sort. Currently Amazon and YouTube monopolize content distribution, the latter with a complete disregard for copyright and media ownership and payment. Suppose we had a tracking system that viewed every view of a video, and rewarded the original producer for it?
To emphasize the previous point, let us consider the case of Lindsey Stirling. Lindsey Stirling is a famous contemporary violinist who dances while playing. Her 118 video uploads have earned her 2,575,305,706 views, 2.5 billion approx, and her earnings from YouTube ads last month was 100K a month. Her net worth as on 10th April 2019 is 12 million USD (12,000,000).
But suppose Lindsey Stirling distributed her videos at a price of 1 USD every view. Her net worth would be 2.6 billion USD at the very least! She would be a multi-billionaire had this platform existed. It doesn’t – yet. And because it doesn’t exist she is 2.49 billion USD poorer!
Now everyone who knows blockchain technology will now realize this idea, the concept, and how blockchain can be used to overcome this problem – and its power. Disruptive power!
The Solution
The blockchain is a service that immutably assigns ownership.
The blockchain is also a database that stores every single transaction on a particular digitisable entity.
Finally, the Ethereum smart contract technology means that we can assign payments to go to every person on his own personal blockchain of all his digitisable goods.
This means we can build a world where producer pays a user-defined amount to every entity which created a particular digitisable product.
On this platform or website or marketplace, producers can adjust their prices and their payments and consumers can buy directly from them.
Everything can be tracked on the blockchain. Your own database of your own transactions can be used with smart contracts to pay the maximum possible fee to the most deserving person in the supply chain – fixed by each producer.
Hugely, Massively Disruptive
If you are interested or want to know more, you can leave a comment below with your email address. If you want to be a part of this new revolution and the new decentralised world – with all services provided free – please provide a comment below asking for my email ID with a statement of what and how you want to contribute to this endeavor. I promise to reply to every sincere query.
This is a fledgling project and a lot of work remains to be done. I will be writing articles and creating a team to work on this idea. Those of you who are interested please mail me at thomascherickal@gmail.com.
This will be an open source project and all services have to be offered free of cost. How do you go about making a profit from this? You don’t! The only way this can be fair to all players in countries like India is if it is specially designed to be applicable to anyone.
So this article gave a small glimpse into a world without intermediaries, corporations, money-making middlemen, and running purely on smart contracts. This is applicable to AI and data science since this technology will not reach anywhere significant without extensive use of AI and data science.
The more data that is available, the more analysis can be performed on it. And unless we have analysts who are running monitoring fraud detection systems fulltime on such a system, we might as well never build it – because blockchain data integrity cannot be hacked, but cryptocurrencies are hackable and have been hacked extensively since the beginning of Bitcoin.
For Part 2 of this series on Blockchain Applications of Data Science, you can go to the link below:
I have just completed my survey of data (from articles, blogs, white papers, university websites, curated tech websites, and research papers all available online) about predictive analytics.
And I have a reason to believe that we are standing on the brink of a revolution that will transform everything we know about data science and predictive analytics.
But before we go there, you need to know: why the hype about predictive analytics? What is predictive analytics?
Let’s cover that first.
Importance of Predictive Analytics
By PhotoMix Ltd
According to Wikipedia:
Predictive analytics is an area of statistics that deals with extracting information from data and using it to predict trends and behavior patterns. The enhancement of predictive web analytics calculates statistical probabilities of future events online. Predictive analytics statistical techniques include data modeling, machine learning, AI, deep learning algorithms and data mining.
Predictive analytics is why every business wants data scientists. Analytics is not just about answering questions, it is also about finding the right questions to answer. The applications for this field are many, nearly every human endeavor can be listed in the excerpt from Wikipedia that follows listing the applications of predictive analytics:
From Wikipedia:
Predictive analytics is used in actuarial science, marketing, financial services, insurance, telecommunications, retail, travel, mobility, healthcare, child protection, pharmaceuticals, capacity planning, social networking, and a multitude of numerous other fields ranging from the military to online shopping websites, Internet of Things (IoT), and advertising.
In a very real sense, predictive analytics means applying data science models to given scenarios that forecast or generate a score of the likelihood of an event occurring. The data generated today is so voluminous that experts estimate that less than 1% is actually used for analysis, optimization, and prediction. In the case of Big Data, that estimate falls to 0.01% or less.
Common Example Use-Cases of Predictive Analytics
Components of Predictive Analytics
A skilled data scientist can utilize the prediction scores to optimize and improve the profit margin of a business or a company by a massive amount. For example:
If you buy a book for children on the Amazon website, the website identifies that you have an interest in that author and that genre and shows you more books similar to the one you just browsed or purchased.
YouTube also has a very similar algorithm behind its video suggestions when you view a particular video. The site identifies (or rather, the analytics algorithms running on the site identifies) more videos that you would enjoy watching based upon what you are watching now. In ML, this is called a recommender system.
Netflix is another famous example where recommender systems play a massive role in the suggestions for ‘shows you may like’ section, and the recommendations are well-known for their accuracy in most cases
Google AdWords (text ads at the top of every Google Search) that are displayed is another example of a machine learning algorithm whose usage can be classified under predictive analytics.
Departmental stores often optimize products so that common groups are easy to find. For example, the fresh fruits and vegetables would be close to the health foods supplements and diet control foods that weight-watchers commonly use. Coffee/tea/milk and biscuits/rusks make another possible grouping. You might think this is trivial, but department stores have recorded up to 20% increase in sales when such optimal grouping and placement was performed – again, through a form of analytics.
Bank loans and home loans are often approved with the credit scores of a customer. How is that calculated? An expert system of rules, classification, and extrapolation of existing patterns – you guessed it – using predictive analytics.
Allocating budgets in a company to maximize the total profit in the upcoming year is predictive analytics. This is simple at a startup, but imagine the situation in a company like Google, with thousands of departments and employees, all clamoring for funding. Predictive Analytics is the way to go in this case as well.
IoT (Internet of Things) smart devices are one of the most promising applications of predictive analytics. It will not be too long before the sensor data from aircraft parts use predictive analytics to tell its operators that it has a high likelihood of failure. Ditto for cars, refrigerators, military equipment, military infrastructure and aircraft, anything that uses IoT (which is nearly every embedded processing device available in the 21st century).
Fraud detection, malware detection, hacker intrusion detection, cryptocurrency hacking, and cryptocurrency theft are all ideal use cases for predictive analytics. In this case, the ML system detects anomalous behavior on an interface used by the hackers and cybercriminals to identify when a theft or a fraud is taking place, has taken place, or will take place in the future. Obviously, this is a dream come true for law enforcement agencies.
So now you know what predictive analytics is and what it can do. Now let’s come to the revolutionary new technology.
End-to-End Predictive Analytics Product – for non-tech users!
In a remarkable first, a research team at MIT, USA have created a new science called social physics, or sociophysics. Now, much about this field is deliberately kept highly confidential, because of its massive disruptive power as far as data science is concerned, especially predictive analytics. The only requirement of this science is that the system being modeled has to be a human-interaction based environment. To keep the discussion simple, we shall explain the entire system in points.
All systems in which human beings are involved follow scientific laws.
These laws have been identified, verified experimentally and derived scientifically.
Bylaws we mean equations, such as (just an example) Newton’s second law: F = m.a (Force equals mass times acceleration)
These equations establish laws of invariance – that are the same regardless of which human-interaction system is being modeled.
Hence the term social physics – like Maxwell’s laws of electromagnetism or Newton’s theory of gravitation, these laws are a new discovery that are universal as long as the agents interacting in the system are humans.
The invariance and universality of these laws have two important consequences:
The need for large amounts of data disappears – Because of the laws, many of the predictive capacities of the model can be obtained with a minimal amount of data. Hence small companies now have the power to use analytics that was mostly used by the FAMGA(Facebook, Amazon, Microsoft, Google, Apple) set of companies since they were the only ones with the money to maintain Big Data warehouses and data lakes.
There is no need for data cleaning. Since the model being used is canonical, it is independent of data problems like outliers, missing data, nonsense data, unavailable data, and data corruption. This is due to the orthogonality of the model ( a Knowledge Sphere) being constructed and the data available.
Performance is superior to deep learning, Google TensorFlow, Python, R, Julia, PyTorch, and scikit-learn. Consistently, the model has outscored the latter models in Kaggle competitions, without any data pre-processing or data preparation and cleansing!
Data being orthogonal to interpretation and manipulation means that encrypted data can be used as-is. There is no need to decrypt encrypted data to perform a data science task or experiment. This is significant because the independence of the model functioning even for encrypted data opens the door to blockchain technology and blockchain data to be used in standard data science tasks. Furthermore, this allows hashing techniques to be used to hide confidential data and perform the data mining task without any knowledge of what the data indicates.
Are You Serious?
That’s a valid question given these claims! And that is why I recommend everyone who has the slightest or smallest interest in data science to visit and completely read and explore the following links:
Now when I say completely read, I mean completely read. Visit every section and read every bit of text that is available on the three sites above. You will soon understand why this is such a revolutionary idea.
These links above are articles about the social physics book and about the science of sociophysics in general.
For more details, please visit the following articles on Medium. These further document Endor.coin, a cryptocurrency built around the idea of sharing data with the public and getting paid for using the system and usage of your data. Preferably, read all, if busy, at least read Article No, 1.
Upon every data set, the first action performed by the Endor Analytics Platform is clustering, also popularly known as automatic classification. Endor constructs what is known as a Knowledge Sphere, a canonical representation of the data set which can be constructed even with 10% of the data volume needed for the same project when deep learning was used.
Creation of the Knowledge Sphere takes 1-4 hours for a billion records dataset (which is pretty standard these days).
Now an explanation of the mathematics behind social physics is beyond our scope, but I will include the change in the data science process when the Endor platform was compared to a deep learning system built to solve the same problem the traditional way (with a 6-figure salary expert data scientist).
From Appendix A: Social Physics Explained, Section 3.1, pages 28-34 (some material not included):
Prediction Demonstration using the Endor System:
Data:
The data that was used in this example originated from a retail financial investment platform
and contained the entire investment transactions of members of an investment community.
The data was anonymized and made public for research purposes at MIT (the data can be
shared upon request).
Summary of the dataset:
– 7 days of data
– 3,719,023 rows
– 178,266 unique users
Automatic Clusters Extraction:
Upon first analysis of the data the Endor system detects and extracts “behavioral clusters” – groups of
users whose data dynamics violates the mathematical invariances of the Social Physics. These clusters
are based on all the columns of the data, but is limited only to the last 7 days – as this is the data that
was provided to the system as input.
Behavioural Clusters Summary
Number of clusters:268,218
Clusters sizes: 62 (Mean), 15 (Median), 52508 (Max), 5 (Min)
Clusters per user:164 (Mean), 118 (Median), 703 (Max), 2 (Min)
Users in clusters: 102,770 out of the 178,266 users
Records per user: 6 (Median), 33 (Mean): applies only to users in clusters
Prediction Queries
The following prediction queries were defined: 1. New users to become “whales”: users who joined in the last 2 weeks that will generate at least
$500 in commission in the next 90 days 2. Reducing activity : users who were active in the last week that will reduce activity by 50% in the
next 30 days (but will not churn, and will still continue trading) 3. Churn in “whales”: currently active “whales” (as defined by their activity during the last 90 days),
who were active in the past week, to become inactive for the next 30 days 4. Will trade in Apple share for the first time: users who had never invested in Apple share, and
would buy it for the first time in the coming 30 days
Knowledge Sphere Manifestation of Queries
It is again important to note that the definition of the search queries is completely orthogonal to the
extraction of behavioral clusters and the generation of the Knowledge Sphere, which was done
independently of the queries definition.
Therefore, it is interesting to analyze the manifestation of the queries in the clusters detected by the system: Do the clusters contain information that is relevant to the definition of the queries, despite the fact that:
1. The clusters were extracted in a fully automatic way, using no semantic information about the
data, and –
2. The queries were defined after the clusters were extracted, and did not affect this process.
This analysis is done by measuring the number of clusters that contain a very high concentration of
“samples”; In other words, by looking for clusters that contain “many more examples than statistically
expected”.
A high number of such clusters (provided that it is significantly higher than the amount
received when randomly sampling the same population) proves the ability of this process to extract
valuable relevant semantic insights in a fully automatic way.
Comparison to Google TensorFlow
In this section a comparison between prediction process of the Endor system and Google’s
TensorFlow is presented. It is important to note that TensorFlow, like any other Deep Learning library,
faces some difficulties when dealing with data similar to the one under discussion:
1. An extremely uneven distribution of the number of records per user requires some canonization
of the data, which in turn requires:
2. Some manual work, done by an individual who has at least some understanding of data
science.
3. Some understanding of the semantics of the data, that requires an investment of time, as
well as access to the owner or provider of the data
4. A single-class classification, using an extremely uneven distribution of positive vs. negative
samples, tends to lead to the overfitting of the results and require some non-trivial maneuvering.
This again necessitates the involvement of an expert in Deep Learning (unlike the Endor system
which can be used by Business, Product or Marketing experts, with no perquisites in Machine
Learning or Data Science).
Traditional Methods
An expert in Deep Learning spent 2 weeks crafting a solution that would be based
on TensorFlow and has sufficient expertise to be able to handle the data. The solution that was created
used the following auxiliary techniques:
1.Trimming the data sequence to 200 records per customer, and padding the streams for users
who have less than 200 records with neutral records.
2.Creating 200 training sets, each having 1,000 customers (50% known positive labels, 50%
unknown) and then using these training sets to train the model.
3.Using sequence classification (RNN with 128 LSTMs) with 2 output neurons (positive,
negative), with the overall result being the difference between the scores of the two.
Observations (all statistics available in the white paper – and it’s stunning)
1.Endor outperforms Tensor Flow in 3 out of 4 queries, and results in the same accuracy in the 4th
.
2.The superiority of Endor is increasingly evident as the task becomes “more difficult” – focusing on
the top-100 rather than the top-500.
3.There is a clear distinction between “less dynamic queries” (becoming a whale, churn, reduce
activity” – for which static signals should likely be easier to detect) than the “Who will trade in
Apple for the first time” query, which are (a) more dynamic, and (b) have a very low baseline, such
that for the latter, Endor is 10x times more accurate!
4.As previously mentioned – the Tensor Flow results illustrated here employ 2 weeks of manual improvements done by a Deep Learning expert, whereas the Endor results are 100% automatic and the entire prediction process in Endor took 4 hours.
Clearly, the path going forward for predictive analytics and data science is Endor, Endor, and Endor again!
Predictions for the Future
Personally, one thing has me sold – the robustness of the Endor system to handle noise and missing data. Earlier, this was the biggest bane of the data scientist in most companies (when data engineers are not available). 90% of the time of a professional data scientist would go into data cleaning and data preprocessing since our ML models were acutely sensitive to noise. This is the first solution that has eliminated this ‘grunt’ level work from data science completely.
The second prediction: the Endor system works upon principles of human interaction dynamics. My intuition tells me that data collected at random has its own dynamical systems that appear clearly to experts in complexity theory. I am completely certain that just as this tool developed a prediction tool with human society dynamical laws, data collected in general has its own laws of invariance. And the first person to identify these laws and build another Endor-style platform on them will be at the top of the data science pyramid – the alpha unicorn.
Final prediction – democratizing data science means that now data scientists are not required to have six-figure salaries. The success of the Endor platform means that anyone can perform advanced data science without resorting to TensorFlow, Python, R, Anaconda, etc. This platform will completely disrupt the entire data science technological sector. The first people to master it and build upon it to formalize the rules of invariance in the case of general data dynamics will for sure make a killing.
It is an exciting time to be a data science researcher!
Data Science is a broad field and it would require quite a few things to learn to master all these skills.
Dimensionless has several resources to get started with.
There are a huge number of ML algorithms out there. Trying to classify them leads to the distinction being made in types of the training procedure, applications, the latest advances, and some of the standard algorithms used by ML scientists in their daily work. There is a lot to cover, and we shall proceed as given in the following listing:
Statistical Algorithms
Classification
Regression
Clustering
Dimensionality Reduction
Ensemble Algorithms
Deep Learning
Reinforcement Learning
AutoML (Bonus)
1. Statistical Algorithms
Statistics is necessary for every machine learning expert. Hypothesis testing and confidence intervals are some of the many statistical concepts to know if you are a data scientist. Here, we consider here the phenomenon of overfitting. Basically, overfitting occurs when an ML model learns so many features of the training data set that the generalization capacity of the model on the test set takes a toss. The tradeoff between performance and overfitting is well illustrated by the following illustration:
Overfitting – from Wikipedia
Here, the black curve represents the performance of a classifier that has appropriately classified the dataset into two categories. Obviously, training the classifier was stopped at the right time in this instance. The green curve indicates what happens when we allow the training of the classifier to ‘overlearn the features’ in the training set. What happens is that we get an accuracy of 100%, but we lose out on performance on the test set because the test set will have a feature boundary that is usually similar but definitely not the same as the training set. This will result in a high error level when the classifier for the green curve is presented with new data. How can we prevent this?
Cross-Validation
Cross-Validation is the killer technique used to avoid overfitting. How does it work? A visual representation of the k-fold cross-validation process is given below:
From Quora
The entire dataset is split into equal subsets and the model is trained on all possible combinations of training and testing subsets that are possible as shown in the image above. Finally, the average of all the models is combined. The advantage of this is that this method eliminates sampling error, prevents overfitting, and accounts for bias. There are further variations of cross-validation like non-exhaustive cross-validation and nested k-fold cross validation (shown above). For more on cross-validation, visit the following link.
There are many more statistical algorithms that a data scientist has to know. Some examples include the chi-squared test, the Student’s t-test, how to calculate confidence intervals, how to interpret p-values, advanced probability theory, and many more. For more, please visit the excellent article given below:
Classification refers to the process of categorizing data input as a member of a target class. An example could be that we can classify customers into low-income, medium-income, and high-income depending upon their spending activity over a financial year. This knowledge can help us tailor the ads shown to them accurately when they come online and maximises the chance of a conversion or a sale. There are various types of classification like binary classification, multi-class classification, and various other variants. It is perhaps the most well known and most common of all data science algorithm categories. The algorithms that can be used for classification include:
Logistic Regression
Support Vector Machines
Linear Discriminant Analysis
K-Nearest Neighbours
Decision Trees
Random Forests
and many more. A short illustration of a binary classification visualization is given below:
From openclassroom.stanford.edu
For more information on classification algorithms, refer to the following excellent links:
Regression is similar to classification, and many algorithms used are similar (e.g. random forests). The difference is that while classification categorizes a data point, regression predicts a continuous real-number value. So classification works with classes while regression works with real numbers. And yes – many algorithms can be used for both classification and regression. Hence the presence of logistic regression in both lists. Some of the common algorithms used for regression are
Linear Regression
Support Vector Regression
Logistic Regression
Ridge Regression
Partial Least-Squares Regression
Non-Linear Regression
For more on regression, I suggest that you visit the following link for an excellent article:
Both articles have a remarkably clear discussion of the statistical theory that you need to know to understand regression and apply it to non-linear problems. They also have source code in Python and R that you can use.
4. Clustering
Clustering is an unsupervised learning algorithm category that divides the data set into groups depending upon common characteristics or common properties. A good example would be grouping the data set instances into categories automatically, the process being used would be any of several algorithms that we shall soon list. For this reason, clustering is sometimes known as automatic classification. It is also a critical part of exploratory data analysis (EDA). Some of the algorithms commonly used for clustering are:
Hierarchical Clustering – Agglomerative
Hierarchical Clustering – Divisive
K-Means Clustering
K-Nearest Neighbours Clustering
EM (Expectation Maximization) Clustering
Principal Components Analysis Clustering (PCA)
An example of a common clustering problem visualization is given below:
From Wikipedia
The above visualization clearly contains three clusters.
Another excellent article on clustering refer the link
Dimensionality Reduction is an extremely important tool that should be completely clear and lucid for any serious data scientist. Dimensionality Reduction is also referred to as feature selection or feature extraction. This means that the principal variables of the data set that contains the highest covariance with the output data are extracted and the features/variables that are not important are ignored. It is an essential part of EDA (Exploratory Data Analysis) and is nearly always used in every moderately or highly difficult problem. The advantages of dimensionality reduction are (from Wikipedia):
It reduces the time and storage space required.
Removal of multi-collinearity improves the interpretation of the parameters of the machine learning model.
It becomes easier to visualize the data when reduced to very low dimensions such as 2D or 3D.
It avoids the curse of dimensionality.
The most commonly used algorithm for dimensionality reduction is Principal Components Analysis or PCA. While this is a linear model, it can be converted to a non-linear model through a kernel trick similar to that used in a Support Vector Machine, in which case the technique is known as Kernel PCA. Thus, the algorithms commonly used are:
Ensembling means combining multiple ML learners together into one pipeline so that the combination of all the weak learners makes an ML application with higher accuracy than each learner taken separately. Intuitively, this makes sense, since the disadvantages of using one model would be offset by combining it with another model that does not suffer from this disadvantage. There are various algorithms used in ensembling machine learning models. The three common techniques usually employed in practice are:
Simple/Weighted Average/Voting: Simplest one, just takes the vote of models in Classification and average in Regression.
Bagging: We train models (same algorithm) in parallel for random sub-samples of data-set with replacement. Eventually, take an average/vote of obtained results.
Boosting: In this models are trained sequentially, where (n)th model uses the output of (n-1)th model and works on the limitation of the previous model, the process stops when result stops improving.
Stacking: We combine two or more than two models using another machine learning algorithm.
(from Amardeep Chauhan on Medium.com)
In all four cases, the combination of the different models ends up having the better performance that one single learner. One particular ensembling technique that has done extremely well on data science competitions on Kaggle is the GBRT model or the Gradient Boosted Regression Tree model.
We include the source code from the scikit-learn module for Gradient Boosted Regression Trees since this is one of the most popular ML models which can be used in competitions like Kaggle, HackerRank, and TopCoder.
GradientBoostingClassifier supports both binary and multi-class classification. The following example shows how to fit a gradient boosting classifier with 100 decision stumps as weak learners:
GradientBoostingRegressor supports a number of different loss functions for regression which can be specified via the argument loss; the default loss function for regression is least squares ('ls').
import numpy as np
from sklearn.metrics import mean_squared_error
from sklearn.datasets import make_friedman1
from sklearn.ensemble import GradientBoostingRegressor

X, y = make_friedman1(n_samples=1200, random_state=0, noise=1.0)
X_train, X_test = X[:200], X[200:]
y_train, y_test = y[:200], y[200:]
est = GradientBoostingRegressor(n_estimators=100, learning_rate=0.1,
    max_depth=1, random_state=0, loss='ls').fit(X_train, y_train)
mean_squared_error(y_test, est.predict(X_test))
You can also refer to the following article which discusses Random Forests, which is a (rather basic) ensembling method.
In the last decade, there has been a renaissance of sorts within the Machine Learning community worldwide. Since 2002, neural networks research had struck a dead end as the networks of layers would get stuck in local minima in the non-linear hyperspace of the energy landscape of a three layer network. Many thought that neural networks had outlived their usefulness. However, starting with Geoffrey Hinton in 2006, researchers found that adding multiple layers of neurons to a neural network created an energy landscape of such high dimensionality that local minima were statistically shown to be extremely unlikely to occur in practice. Today, in 2019, more than a decade of innovation later, this method of adding addition hidden layers of neurons to a neural network is the classical practice of the field known as deep learning.
Deep Learning has truly taken the computing world by storm and has been applied to nearly every field of computation, with great success. Now with advances in Computer Vision, Image Processing, Reinforcement Learning, and Evolutionary Computation, we have marvellous feats of technology like self-driving cars and self-learning expert systems that perform enormously complex tasks like playing the game of Go (not to be confused with the Go programming language). The main reason these feats are possible is the success of deep learning and reinforcement learning (more on the latter given in the next section below). Some of the important algorithms and applications that data scientists have to be aware of in deep learning are:
Long Short term Memories (LSTMs) for Natural Language Processing
Recurrent Neural Networks (RNNs) for Speech Recognition
Convolutional Neural Networks (CNNs) for Image Processing
Deep Neural Networks (DNNs) for Image Recognition and Classification
Hybrid Architectures for Recommender Systems
Autoencoders (ANNs) for Bioinformatics, Wearables, and Healthcare
Deep Learning Networks typically have millions of neurons and hundreds of millions of connections between neurons. Training such networks is such a computationally intensive task that now companies are turning to the 1) Cloud Computing Systems and 2) Graphical Processing Unit (GPU) Parallel High-Performance Processing Systems for their computational needs. It is now common to find hundreds of GPUs operating in parallel to train ridiculously high dimensional neural networks for amazing applications like dreaming during sleep and computer artistry and artistic creativity pleasing to our aesthetic senses.
Artistic Image Created By A Deep Learning Network. From blog.kadenze.com.
For more on Deep Learning, please visit the following links:
In the recent past and the last three years in particular, reinforcement learning has become remarkably famous for a number of achievements in cognition that were earlier thought to be limited to humans. Basically put, reinforcement learning deals with the ability of a computer to teach itself. We have the idea of a reward vs. penalty approach. The computer is given a scenario and ‘rewarded’ with points for correct behaviour and ‘penalties’ are imposed for wrong behaviour. The computer is provided with a problem formulated as a Markov Decision Process, or MDP. Some basic types of Reinforcement Learning algorithms to be aware of are (some extracts from Wikipedia):
1.Q-Learning
Q-Learning is a model-free reinforcement learning algorithm. The goal of Q-learning is to learn a policy, which tells an agent what action to take under what circumstances. It does not require a model (hence the connotation “model-free”) of the environment, and it can handle problems with stochastic transitions and rewards, without requiring adaptations. For any finite Markov decision process (FMDP), Q-learning finds a policy that is optimal in the sense that it maximizes the expected value of the total reward over any and all successive steps, starting from the current state. Q-learning can identify an optimal action-selection policy for any given FMDP, given infinite exploration time and a partly-random policy. “Q” names the function that returns the reward used to provide the reinforcement and can be said to stand for the “quality” of an action taken in a given state.
2.SARSA
State–action–reward–state–action (SARSA) is an algorithm for learning a Markov decision process policy. This name simply reflects the fact that the main function for updating the Q-value depends on the current state of the agent “S1“, the action the agent chooses “A1“, the reward “R” the agent gets for choosing this action, the state “S2” that the agent enters after taking that action, and finally the next action “A2” the agent choose in its new state. The acronym for the quintuple (st, at, rt, st+1, at+1) is SARSA.
3.Deep Reinforcement Learning
This approach extends reinforcement learning by using a deep neural network and without explicitly designing the state space. The work on learning ATARI games by Google DeepMind increased attention to deep reinforcement learning or end-to-end reinforcement learning. Remarkably, the computer agent DeepMind has achieved levels of skill higher than humans at playing computer games. Even a complex game like DOTA 2 was won by a deep reinforcement learning network based upon DeepMind and OpenAI Gym environments that beat human players 3-2 in a tournament of best of five matches.
For more information, go through the following links:
If reinforcement learning was cutting edge data science, AutoML is bleeding edge data science. AutoML (Automated Machine Learning) is a remarkable project that is open source and available on GitHub at the following link that, remarkably, uses an algorithm and a data analysis approach to construct an end-to-end data science project that does data-preprocessing, algorithm selection,hyperparameter tuning, cross-validation and algorithm optimization to completely automate the ML process into the hands of a computer. Amazingly, what this means is that now computers can handle the ML expertise that was earlier in the hands of a few limited ML practitioners and AI experts.
AutoML has found its way into Google TensorFlow through AutoKeras, Microsoft CNTK, and Google Cloud Platform, Microsoft Azure, and Amazon Web Services (AWS). Currently it is a premiere paid model for even a moderately sized dataset and is free only for tiny datasets. However, one entire process might take one to two or more days to execute completely. But at least, now the computer AI industry has come full circle. We now have computers so complex that they are taking the machine learning process out of the hands of the humans and creating models that are significantly more accurate and faster than the ones created by human beings!
The basic algorithm used by AutoML is Network Architecture Search and its variants, given below:
Network Architecture Search (NAS)
PNAS (Progressive NAS)
ENAS (Efficient NAS)
The functioning of AutoML is given by the following diagram:
If you’ve stayed with me till now, congratulations; you have learnt a lot of information and cutting edge technology that you must read up on, much, much more. You could start with the links in this article, and of course, Google is your best friend as a Machine Learning Practitioner. Enjoy machine learning!
So you want to learn data science but you don’t know where to start? Or you are a beginner and you want to learn the basic concepts? Welcome to your new career and your new life! You will discover a lot of things on your journey to becoming a data scientist and being part of a new revolution. I am a firm believer that you can learn data science and become a data scientist regardless of your age, your background, your current knowledge level, your gender, and your current position in life. I believe – from experience – that anyone can learn anything at any stage in their lives. What is required is just determination, persistence, and a tireless commitment to hard work. Nothing else matters as far as learning new things – or learning data science – is concerned. Your commitment, persistence, and your investment in your available daily time is enough.
I hope you understood my statement. Anyone can learn data science if you have the right motivation. In fact, I believe anyone can learn anything at any stage in their lives, if they invest enough time, effort and hard work into it, along with your current occupation. From my experience, I strongly recommend that you continue your day job and work on data science as a side hustle, because of the hard work that will be involved. Your commitment is more important than your current life situation. Carrying on a full-time job and working on data science part-time is the best way to go if you want to learn in the best possible manner.
Technical Concepts of Data Science
So what are the important concepts of data science that you should know as a beginner? They are, in order of sequential learning, the following:
Python Programming
R Programming
Statistics & Probability
Linear Algebra
Data Preparation and Data ETL*
Machine Learning with Python and R
Data Visualization and Summary
*Extraction, Transformation, and Loading
Now if you were to look at the above list an go to a library, you would, most likely, come back with 9-10 books at an average of 1000 pages each. Even if you could speed-read, 10,000 pages is a lot to get through. I could list the best books for each topic in this post, but even the most seasoned reader would balk at 10,000 pages. And who reads books these days? So what I am going to give you is a distilled extract on each of those topics. Keep in mind, however, that every topic given above could be a series of blog posts in its own right, and these 80-word paragraphs are just a tiny taste of each topic and there is an ocean of depth involved in every topic. You might ask if that is the case, how can everybody be a possible candidate for data scientist role? Two words: Persistence and Motivation. With the right amount of these two characteristics, anyone can be anything they want to be.
1) Python Programming:
Python is one of the most popular programming languages in the world. It is the ABC of data science because Python is the language every beginner starts with on data science. It is universally used for any purposes since it is so amazingly versatile. Python can be used for web applications and websites with Django, microservices with Flask, general programming projects with the standard library from PyPI, GUIs with PyQt5 or Tkinter, Interoperability with Jython (Java), Cython (C) and nearly other programming language are available today.
Of course, Python is the also first language used for data science with the standard stack of scikit-learn (machine learning), pandas (data manipulation), matplotlib and seaborn (visualization) and numpy (vectorized computation). Nowadays, the most common technology used is the Anaconda distribution, available from www.anaconda.com. Current version 2018.12 or Anaconda Distribution 5. To learn more about Python, I strongly recommend the following books: Head First Python and the Python Cookbook.
2) R Programming
R is The Best Language for statistical needs since it is a language designed by statisticians, for statisticians. If you know statistics and mathematics well, you will enjoy programming in R. The language gives you the best support available for every probability distribution, statistics functions, mathematical functions, plotting, visualization, interoperability, and even machine learning and AI. In fact, everything that you can do in Python can be done in R. R is the second most popular language for data science in the world, second only to Python. R has a rich ecosystem for every data science requirement and is the favorite language of academicians and researchers in the academic domain.
Learning Python is not enough to be a professional data scientist. You need to know R as well. A good book to start with is R For Data Science, available at Amazon at a very reasonable price. Some of the most popular packages in R that you need to know are ggplot2, ThreeJS, DT (tables), network3D, and leaflet for visualization, dplyr and tidyr for data manipulation, shiny and R Markdown for reporting, parallel, Rcpp and data.table for high performance computing and caret, glmnet, and randomForest for machine learning.
3) Statistics and Probability
This is the bread and butter of every data scientist. The best programming skills in the world will be useless without knowledge of statistics. You need to master statistics, especially practical knowledge as used in a scientific experimental analysis. There is a lot to cover. Any subtopic given below can be a blog-post in its own right. Some of the more important areas that a data scientist needs to master are:
Succinctly, linear algebra is about vectors, matrices and the operations that can be performed on vectors and matrices. This is a fundamental area for data science since every operation we do as a data scientist has a linear algebra background, or, as data scientists, we usually work with collections of vectors or matrices. So we have the following topics in Linear Algebra, all of which are covered in the following world-famous book, Linear Algebra and its Applications by Gilbert Strang, an MIT professor. You can also go to the popular MIT OpenCourseWare page, Linear Algebra (MIT OCW). These two resources cover everything you need to know. Some of the most fundamental concepts that you can also Google or bring up on Wikipedia are:
5) Data Preparation and Data ETL (Extraction, Transformation, and Loading)
By IAmMrRob on Pixabay
Yes – welcome to one of the more infamous sides of data science! If data science has a dark side, this is it. Know for sure that unless your company has some dedicated data engineers who do all the data munging and data wrangling for you, 90% of your time on the job will be spent on working with raw data. Real world data has major problems. Usually, it’s unstructured, in the wrong formats, poorly organized, contains many missing values, contains many invalid values, and contains types that are not suitable for data mining.
Dealing with this problem takes up a lot of the time of a data scientist. And your data scientist’s analysis has the potential to go massively wrong when there is invalid and missing data. Practically speaking, unless you are unusually blessed, you will have to manage your own data, and that means conducting your own ETL (Extraction, Transformation, and Loading). ETL is a data mining and data warehousing term that means loading data from an external data store or data mart into a form suitable for data mining and in a state suitable for data analysis (which usually involves a lot of data preprocessing). Finally, you often have to load data that is too big for your working memory – a problem referred to as external loading. During your data wrangling phase, be sure to look into the following components:
Missing data
Invalid data
Data preprocessing
Data validation
Data verification
Automating the Data ETL Pipeline
Automation of Data Validation and Verification
Usually, expert data scientists try to automate this process as much as possible, since a human being would be wearied by this task very fast and is remarkably prone to errors, which will not happen in the case of a Python or an R script doing the same operations. Be sure to try to automate every stage in your data processing pipeline.
6) Machine Learning with Python and R
An expert machine learning scientist has to be proficient in the following areas at the very least:
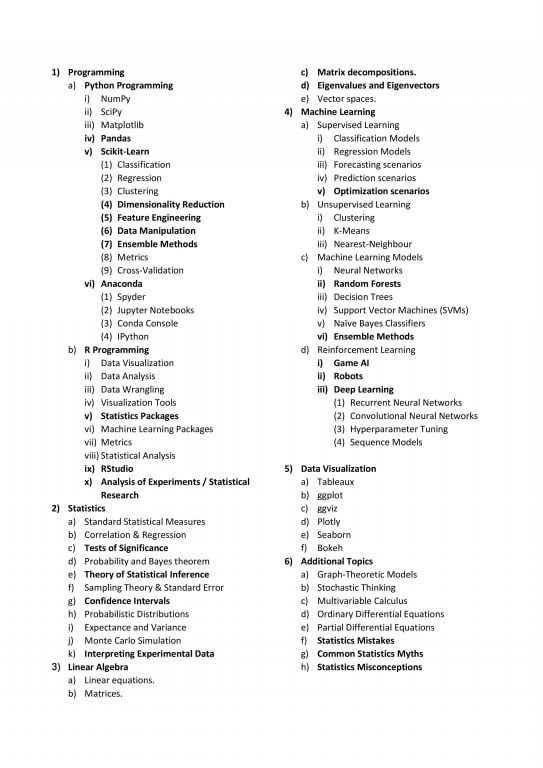
Data Science Topics Listing – Thomas
Now if you are just starting out in Machine Learning (ML), Python, and R, you will gain a sense of how huge the field is and the entire set of lists above might seem more like advanced Greek instead of Plain Jane English. But not to worry; there are ways to streamline your learning and to consume as little time as possible in learning or becoming able to learn nearly every single topic given above. After you learn the basics of Python and R, you need to go on to start building machine learning models. From experience, I suggest you break up your time into 50% of Python and 50% of R and spend as much time as possible spending time without switching your languages or working between languages. What do I mean? Spend maximum time learning one programming language at one time. That will prevent syntax errors and conceptual errors and language confusion problems.
Now, on the job, in real life, it is much more likely that you will work in a team and be responsible for only one part of the work. However, if your working in a startup or learning initially, you will end up doing every phase of the work yourself. Be sure to give yourself time to process information and to spend sufficient time for your brain to rest and get a handle on the topics you are trying to learn. For more info, do check out the Learning How to Learn MOOC on Coursera, which is the best way to learn mathematical or scientific topics without ending up with burn out. In fact, I would recommend this approach to every programmer out there trying to learn a programming language, or anything considered difficult, like Quantum Mechanics and Quantum Computation or String Theory, or even Microsoft F# or Microsoft C# for a non-Java programmer.
Common tools that you have with which you can produce powerful visualizations include:
Matplotlib
Seaborn
Bokeh
ggplot2
plot.ly
D3.js
Tableau
Google Data Studio
Microsoft Power BI Desktop
Some involve coding, some are drag-and-drop, some are difficult for beginners, some have no coding at all. All of these tools will help you with data visualization. But one of the most overlooked but critical practical functions of a data scientist has been included under this heading: summarisation.
Summarisation means the practical result of your data science workflow. What does the result of your analysis mean for the operation of the business or the research problem that you are currently working on? How do you convert your result to the maximum improvement for your business? Can you measure the impact this result will have on the profit of your enterprise? If so, how? Being able to come out of a data science workflow with this result is one of the most important capacities of a data scientist. And most of the time, efficient summarisation = excellent knowledge of statistics. Please know for sure that statistics is the start and the end of every data science workflow. And you cannot afford to be ignorant about it. Refer to the section on statistics or google the term for extra sources of information.
How Can I Learn Everything Above In the Shortest Possible Time?
You might wonder – How can I learn everything given above? Is there a course ora pathway to learn every single concept described in this article at one shot? It turns out – there is. There is a dream course for a data scientist that contains nearly everything talked about in this article.
Want to Become a Data Scientist? Welcome to Dimensionless Technologies! It just so happens that the course: Data Science using Python and R, a ten-week course that includes ML, Python and R programming, Statistics, Github Account Project Guidance, and Job Placement, offers nearly every component spoken about above, and more besides. You don’t know to buy the books or do any of the courses other than this to learn the topics in this article. Everything is covered by this single course, tailormade to convert you to a data scientist within the shortest possible time. For more, I’d like to refer you to the following link:
Does this seem too good to be true? Perhaps, because this is a paid course. With a scholarship concession, you could end up paying around INR 40,000 for this ten-week course, two weeks of which you can register for 5,000 and pay the remainder after two weeks trial period to see if this course really suits you. If it doesn’t, you can always drop out after two weeks and be poorer by just 5k. But in most cases, this course has been found to carry genuine worth. And nothing worthwhile was achieved without some payment, right?
In case you want to learn more about data science, please check out the following articles:
Traditionally speaking, interviews are the bane of the IT world and it’s no secret that most interview methods that are commonly used are flawed. They favor problem-solving skills while not measuring things much more important like teamwork skills and ability to be humble but yet competent so that they fit well into any company. There is a lot to discuss on this issue. The main reason you want to check the competency of an individual is for the hiring process, to hire new people. There is a fundamentally reasonable way to do this.
Pardon – you mean that there is a way to evaluate a fresh person accurately for technical acumen, beyond open-ended interviews? Does that go beyond interview bias? And traditional stereotyping?
Yes.
While there are methods to evaluate the competence, like the data science matrix of competency from Link, there is a need for greater objective assessment. While the data science matrix of competence – shown below:
By Schaun Wheeler on Medium – Towards Data Science – A framework for evaluating data scientist competency
And by competence that is conscious and unconscious, we mean the following :
By Schaun Wheeler on Medium – Towards Data Science – (same article) A framework for evaluating data scientist competency
– is a great tool, it is used best by people who are judging themselves. but do read the article if you are interested in this aspect of assessing data science professionals. The link is here
A more consistent and remarkable way to consistently hire great talent on a regular basis is given in this article: link
It is this article which gives an excellent way to evaluate data science abilities, directed towards the hiring process. How do they do it?
Photo by Ben Mullins on Unsplash
The First Way – The Take-Home Test
Ideally, you want all your candidates to have an even playing field. This means that in the first round of the interview process, you want to measure them at the same scale. This test should be:
Explicit – nobody should have to contact you for doubts or questions
Graded – there should be a linear increase in the difficulty level of the questions
Short – An expert candidate should take no longer than two hours to complete all the questions
Comprehensive – The questions should represent the skills on an average day of work
Public – Give only publicizable data since this will be available to the general public
This component should test the following areas:
Statistics – Make sure you cover Hypothesis Testing, the Central Limit Theorem, and Analysis of Experiments and Confidence Intervals
Basic Mathematics – Linear Algebra, Matrix Algebra, Probability, Bayes Theorem or Conditional Probability, Basics of Differential Equations if necessary
Coding Skills – Modularization, Functional, Documented, Testability, Usage of Modern Technology as far as choice of tools and libraries, the maturity of programming language expertise (e.g. Python generator functions)
Methodology – How correct is the answer and is the logical process sound? Have the correct methods been used? Is the answer reproducible and clearly accurate?
Communication Skills – How is the process explainable to someone in management? Is the communication clear enough for a layman, with the right balance of technical terms and simple explanations?
Once the candidate is through this process, you can go on to the next three steps, encapsulated in the Data Day:
Photo by Annie Spratt on Unsplash
The Data Day
A full day spent working beside the team on a more open-ended challenge, concluding with a presentation of their work to a group. While this is a challenging process to organize and execute, this is the ”gold standard” of the interview evaluation process. As of today, there is no better way to evaluate the candidate on the technical skill, as well as culture and work fit for the entire company.
Data Day is a simulation of a typical day at the company. Most candidates will expect a four-hour challenge, but you will have to convince them to spend an entire day at your company. So you will have to give them a sales pitch about data science at your company. The better your pitch, the more people will come to your Data Day.
Once they arrive for the Data Day, each candidate is assigned a “buddy” (contact at the organization), a laptop with prerequisite software that your company uses, and a data set. Working in conjunction with your team, each candidate has to come up with:
Direction: An output of the analysis of the data and the project requirement, they have to spend some time with the team deciding how their project as to go forward.
Execution: Each candidate has to execute on his plan and come up with a concrete, functioning analysis and preprocessing, modeling, hyperparameter tuning, and conclusion of the data science project, all the time, working in conjunction with your existing team.
Presentation: The candidate has to present his project and his findings with the dataset to the entire team and be ready to answer the questions of the entire team cogently and accurately.
Once the candidate leaves the entire team meets for a one-hour meeting about each candidate. There are two fundamental metrics:
1. Problem structuring How did the candidate structure the problem, what assumptions did the candidate make and how did the candidate narrow the scope?
2. Technical rigor How reliable, readable and flexible was the code that the candidate developed to accomplish your work? How scalable would the approach be?
3. Analytical rigor How logically sound, complete and meaningful was the approach (machine learning, statistics, analytics, visualization) that the candidate applied?
4. Communication How clearly was the candidate able to describe your work, approach, methodology and conclusions? How effectively did the candidate answer questions?
5. Usefulness If made production-worthy, how useful would the results of the candidate’s work be to the company?
The Third Way – Data Day – Cultural Fit
If there is even one single existing employee who feels lukewarm about the candidate, that candidate is rejected. In order to avoid bias, the least experienced employees speak first and the most experienced employees speak last. The candidate’s culture fit and workplace vibes and fitting with the team are discussed openly. Quoting from the original article:
When this happens for culture fit or communication reasons, it’s critical to discuss the issue openly. That helps establish and reinforce a healthy norm for how your team wants to behave, and reduces the risk of succumbing to one individual’s biases.
If everyone is lukewarm about a candidate, that is also an obvious “no.” Often this is due to limitations in their work — how much they accomplished, the rigor in their thinking, or their technical execution. If an impasse remains, then either the team leader should make a final decision (err on the side of rejection), or in rare cases, you may want to invite the candidate back for further discussion.
The Fourth Way – Running a Data Science Competition
This might be a slightly expensive way to hire and attract new talent, but it is remarkably the most wide-ranging and the most objective way to hire and attract technical skill. Of course, the main problem is that your data cannot be sensitive, it must be public and open for anyone to see. Other than this, there is no better way to go through the entire length and breadth of the online data science community to get a critical project done by offering a token sum of money as a reward. This is any day preferable to hiring a new employee from scratch. You automatically know that the top ten winning candidates have what it takes technically, so you are free to explore the other metrics, like culture fit, communication, temperament and of course, workplace attitude! Some of the possible platforms on which you can post competitions are: Kaggle
While all the above methods are excellent at covering technical skill, there is a lot more to a candidate than technical skills. I found a post on Quora that mentions some really simple questions that are insignificant but reveal a lot about the candidate. These are the questions that you should ask every candidate because they are innocuous, but reveal a lot about the candidate’s mindset. The questions are:
Do you consider yourself lucky? (checks humility over cocksureness for a candidate successful in the past)
How was the traffic on the commute today? (checks complaining nature over a positive attitude seeing the good in everything)
What is the opinion you have of your last boss? (checks tendency to bad-mouth and gossip instead of being prudent and honoring loyalties)
What were the problems you had with your last team at work (checks tendency to take personal responsibility for every aspect of your project or tendency to put the blame on others)
How much should we pay you as a salary and why? (Again checks modesty, humility, and balance of pleasant stating over the facts in the industry over tendencies to ever sell yourself and be bombastic in the greed for money)
What are your strengths and weaknesses? (By this time, you already have a good idea but this demonstrates a candidate’s self-awareness versus candidate’s tendency to paint an overly rosy picture of themselves, because everyone has weaknesses)
What can you tell us about our company? (Checks the research the candidate has put into the company and how much the candidate has prepared for this interview (principle of hard meaningful work)
These are my questions, I am sure you will have a lot more of your own.
Concluding Words
So these are my best ways to test the competency of data science aptitude. You will notice that the points mentioned here have a bias towards hiring employees – and rightly so since that is exactly when you want to test the skills of the employees the most. You can follow as much of these practices on a general basis as you would like. However, remember that even the best strategies can sometimes lead to candidates who might not be ideal. At such times, it is important to learn from every hire, track the employee’s performance and create a database where you track the initial impression of certain employees and the final performance of those employees. It is always important to keep learning, changing, modifying, and understanding. Keep a steady track of your progress. And you will find that your abilities to track data science competency become better as you improve your own evaluation strategies over time. All the best!
Never thought that online trading could be so helpful because of so many scammers online until I met Miss Judith... Philpot who changed my life and that of my family. I invested $1000 and got $7,000 Within a week. she is an expert and also proven to be trustworthy and reliable. Contact her via: Whatsapp: +17327126738 Email:judithphilpot220@gmail.comread more
A very big thank you to you all sharing her good work as an expert in crypto and forex trade option. Thanks for... everything you have done for me, I trusted her and she delivered as promised. Investing $500 and got a profit of $5,500 in 7 working days, with her great skill in mining and trading in my wallet.
judith Philpot company line:... WhatsApp:+17327126738 Email:Judithphilpot220@gmail.comread more
Faculty knowledge is good but they didn't cover most of the topics which was mentioned in curriculum during online... session. Instead they provided recorded session for those.read more
Dimensionless is great place for you to begin exploring Data science under the guidance of experts. Both Himanshu and... Kushagra sir are excellent teachers as well as mentors,always available to help students and so are the HR and the faulty.Apart from the class timings as well, they have always made time to help and coach with any queries.I thank Dimensionless for helping me get a good starting point in Data science.read more
My experience with the data science course at Dimensionless has been extremely positive. The course was effectively... structured . The instructors were passionate and attentive to all students at every live sessions. I could balance the missed live sessions with recorded ones. I have greatly enjoyed the class and would highly recommend it to my friends and peers.
Special thanks to the entire team for all the personal attention they provide to query of each and every student.read more
It has been a great experience with Dimensionless . Especially from the support team , once you get enrolled , you... don't need to worry about anything , they keep updating each and everything. Teaching staffs are very supportive , even you don't know any thing you can ask without any hesitation and they are always ready to guide . Definitely it is a very good place to boost careerread more
The training experience has been really good! Specially the support after training!! HR team is really good. They keep... you posted on all the openings regularly since the time you join the course!! Overall a good experience!!read more
Dimensionless is the place where you can become a hero from zero in Data Science Field. I really would recommend to all... my fellow mates. The timings are proper, the teaching is awsome,the teachers are well my mentors now. All inclusive I would say that Kush Sir, Himanshu sir and Pranali Mam are the real backbones of Data Science Course who could teach you so well that even a person from non- Math background can learn it. The course material is the bonus of this course and also you will be getting the recordings of every session. I learnt a lot about data science and Now I find it easy because of these wonderful faculty who taught me. Also you will get the good placement assistance as well as resume bulding guidance from Venu Mam. I am glad that I joined dimensionless and also looking forward to start my journey in data science field. I want to thank Dimensionless because of their hard work and Presence it made it easy for me to restart my career. Thank you so much to all the Teachers in Dimensionless !read more
Dimensionless has great teaching staff they not only cover each and every topic but makes sure that every student gets... the topic crystal clear. They never hesitate to repeat same topic and if someone is still confused on it then special doubt clearing sessions are organised. HR is constantly busy sending us new openings in multiple companies from fresher to Experienced. I would really thank all the dimensionless team for showing such support and consistency in every thing.read more
I had great learning experience with Dimensionless. I am suggesting Dimensionless because of its great mentors... specially Kushagra and Himanshu. they don't move to next topic without clearing the concept.read more
My experience with Dimensionless has been very good. All the topics are very well taught and in-depth concepts are... covered. The best thing is that you can resolve your doubts quickly as its a live one on one teaching. The trainers are very friendly and make sure everyone's doubts are cleared. In fact, they have always happily helped me with my issues even though my course is completed.read more
I would highly recommend dimensionless as course design & coaches start from basics and provide you with a real-life... case study. Most important is efforts by all trainers to resolve every doubts and support helps make difficult topics easy..read more
Dimensionless is great platform to kick start your Data Science Studies. Even if you are not having programming skills... you will able to learn all the required skills in this class.All the faculties are well experienced which helped me alot. I would like to thanks Himanshu, Pranali , Kush for your great support. Thanks to Venu as well for sharing videos on timely basis...😊
I highly recommend dimensionless for data science training and I have also been completed my training in data science... with dimensionless. Dimensionless trainer have very good, highly skilled and excellent approach. I will convey all the best for their good work. Regards Avneetread more
After a thinking a lot finally I joined here in Dimensionless for DataScience course. The instructors are experienced &... friendly in nature. They listen patiently & care for each & every students's doubts & clarify those with day-to-day life examples. The course contents are good & the presentation skills are commendable. From a student's perspective they do not leave any concept untouched. The step by step approach of presenting is making a difficult concept easier. Both Himanshu & Kush are masters of presenting tough concepts as easy as possible. I would like to thank all instructors: Himanshu, Kush & Pranali.read more
When I start thinking about to learn Data Science, I was trying to find a course which can me a solid understanding of... Statistics and the Math behind ML algorithms. Then I have come across Dimensionless, I had a demo and went through all my Q&A, course curriculum and it has given me enough confidence to get started. I have been taught statistics by Kush and ML from Himanshu, I can confidently say the kind of stuff they deliver is In depth and with ease of understanding!read more
If you love playing with data & looking for a career change in Data science field ,then Dimensionless is the best... platform . It was a wonderful learning experience at dimensionless. The course contents are very well structured which covers from very basics to hardcore . Sessions are very interactive & every doubts were taken care of. Both the instructors Himanshu & kushagra are highly skilled, experienced,very patient & tries to explain the underlying concept in depth with n number of examples. Solving a number of case studies from different domains provides hands-on experience & will boost your confidence. Last but not the least HR staff (Venu) is very supportive & also helps in building your CV according to prior experience and industry requirements. I would love to be back here whenever i need any training in Data science further.read more
It was great learning experience with statistical machine learning using R and python. I had taken courses from... Coursera in past but attention to details on each concept along with hands on during live meeting no one can beat the dimensionless team.read more
I would say power packed content on Data Science through R and Python. If you aspire to indulge in these newer... technologies, you have come at right place. The faculties have real life industry experience, IIT grads, uses new technologies to give you classroom like experience. The whole team is highly motivated and they go extra mile to make your journey easier. I’m glad that I was introduced to this team one of my friends and I further highly recommend to all the aspiring Data Scientists.read more
It was an awesome experience while learning data science and machine learning concepts from dimensionless. The course... contents are very good and covers all the requirements for a data science course. Both the trainers Himanshu and Kushagra are excellent and pays personal attention to everyone in the session. thanks alot !!read more
Had a great experience with dimensionless.!! I attended the Data science with R course, and to my finding this... course is very well structured and covers all concepts and theories that form the base to step into a data science career. Infact better than most of the MOOCs. Excellent and dedicated faculties to guide you through the course and answer all your queries, and providing individual attention as much as possible.(which is really good). Also weekly assignments and its discussion helps a lot in understanding the concepts. Overall a great place to seek guidance and embark your journey towards data science.read more
Excellent study material and tutorials. The tutors knowledge of subjects are exceptional. The most effective part... of curriculum was impressive teaching style especially that of Himanshu. I would like to extend my thanks to Venu, who is very responsible in her jobread more
It was a very good experience learning Data Science with Dimensionless. The classes were very interactive and every... query/doubts of students were taken care of. Course structure had been framed in a very structured manner. Both the trainers possess in-depth knowledge of data science dimain with excellent teaching skills. The case studies given are from different domains so that we get all round exposure to use analytics in various fields. One of the best thing was other support(HR) staff available 24/7 to listen and help.I recommend data Science course from Dimensionless.read more
I was a part of 'Data Science using R' course. Overall experience was great and concepts of Machine Learning with R... were covered beautifully. The style of teaching of Himanshu and Kush was quite good and all topics were generally explained by giving some real world examples. The assignments and case studies were challenging and will give you exposure to the type of projects that Analytics companies actually work upon. Overall experience has been great and I would like to thank the entire Dimensionless team for helping me throughout this course. Best wishes for the future.read more
It was a great experience leaning data Science with Dimensionless .Online and interactive classes makes it easy to... learn inspite of busy schedule. Faculty were truly remarkable and support services to adhere queries and concerns were also very quick. Himanshu and Kush have tremendous knowledge of data science and have excellent teaching skills and are problem solving..Help in interviews preparations and Resume building...Overall a great learning platform. HR is excellent and very interactive. Everytime available over phone call, whatsapp, mails... Shares lots of job opportunities on the daily bases... guidance on resume building, interviews, jobs, companies!!!! They are just excellent!!!!! I would recommend everyone to learn Data science from Dimensionless only 😊read more
I am very glad to be part of Dimensionless .Their dedication, in-depth knowledge, teaching and the way they explain to... clarify doubts is tremendous . I recommend this to everyone who wish to build their career in Data Science
With whole heartedly I wish them for their success & future prospectsread more
Being a part of IT industry for nearly 10 years, I have come across many trainings, organized internally or externally,... but I never had the trainers like Dimensionless has provided. Their pure dedication and diligence really hard to find. The kind of knowledge they possess is imperative. Sometimes trainers do have knowledge but they lack in explaining them. Dimensionless Trainers can give you ‘N’ number of examples to explain each and every small topic, which shows their amazing teaching skills and In-Depth knowledge of the subject. Himanshu and Kush provides you the personal touch whenever you need. They always listen to your problems and try to resolve them devotionally.
I am glad to be a part of Dimensionless and will always come back whenever I need any specific training in Data Science. I recommend this to everyone who is looking for Data Science career as an alternative.
All the best guys, wish you all the success!!read more