
Introduction
What does your business do with the huge volumes of data collected daily? For business, the huge volumes of data collected daily can be demanding and time-consuming. Gathering, analyzing and reporting this type of information and discovering the most important data from the report can be supported through clustering it all.
Clustering can help businesses to manage their data better – image segmentation, grouping web pages, market segmentation, and information retrieval are four examples. For retail businesses, data clustering helps with customer shopping behaviour, sales campaigns, and customer retention. In the insurance industry, clustering is regularly employed in fraud detection, risk factor identification and customer retention efforts. In banking, clustering is used for customer segmentation, credit scoring and analyzing customer profitability.
In this blog, we will understand cluster analysis in detail. We will also look at implementing cluster analysis in python and visualise results in the end!
What is Cluster Analysis?
Clustering is the process of grouping observations of similar kinds into smaller groups within the larger population. It has a widespread application in business analytics. One of the questions facing businesses is how to organize the huge amounts of available data into meaningful structures. Or break a large heterogeneous population into smaller homogeneous groups. Cluster analysis is an exploratory data analysis tool which aims at sorting different objects into groups in a way that the degree of association between two objects is maximal if they belong to the same group and minimal otherwise.
For example, A grocer retailer used clustering to segment its 1.3MM loyalty card customers into 5 different groups based on their buying behaviour. It then adopted customized marketing strategies for each of these segments in order to target them more effectively.
Applications of Cluster Analysis
1. Marketing
Help marketers discover distinct groups in their customer bases and then use this knowledge to develop targeted marketing programs
2. Land Use
Identification of areas of similar land use in an earth observation database
3. Insurance
Identifying groups of motor insurance policyholders with a high average claim cost
4. City-Planning
Identifying groups of houses according to their house type, value, and geographical location
5. Earthquake Studies
Observed earthquake epicenters should be clustered along continent faults
Algorithms for Cluster Analysis
1. K- Means clustering
Kmeans algorithm is an iterative algorithm that tries to partition the dataset into Kpre-defined distinct non-overlapping subgroups (clusters) where each data point belongs to only one group. It tries to make the inter-cluster data points as similar as possible while also keeping the clusters as different (far) as possible. It assigns data points to a cluster such that the sum of the squared distance between the data points and the cluster’s centroid (arithmetic mean of all the data points that belong to that cluster) is at the minimum. The less variation we have within clusters, the more homogeneous (similar) the data points are within the same cluster.
The way the kmeans algorithm works is as follows:
- Specify the number of clusters K.
- Initialize centroids by first shuffling the dataset and then randomly selecting K data points for the centroids without replacement.
- Keep iterating until there is no change to the centroids. i.e assignment of data points to clusters isn’t changing.
- Compute the sum of the squared distance between data points and all centroids.
- Assign each data point to the closest cluster (centroid).
- Compute the centroids for the clusters by taking the average of all data points that belong to each cluster.
The approach the kmeans follows to solve the problem is called Expectation-Maximization. The E-step is assigning the data points to the closest cluster. The M-step is computing the centroid of each cluster. Below is a break down of how we can solve it mathematically (feel free to skip it).
The objective function is:
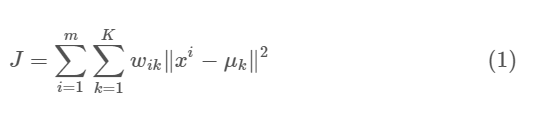
where wik=1 for data point xi if it belongs to cluster k; otherwise, wik=0. Also, μk is the centroid of xi’s cluster.
2. Hierarchical Clustering
Hierarchical clustering is a type of unsupervised machine learning algorithm used to cluster unlabeled data points. Like K-means clustering, hierarchical clustering also groups together the data points with similar characteristics. In some cases, the result of hierarchical and K-Means clustering can be similar.
Following are the steps involved in agglomerative clustering:
- At the start, treat each data point as one cluster. Therefore, the number of clusters at the start will be K, while K is an integer representing the number of data points.
- Form a cluster by joining the two closest data points resulting in K-1 clusters.
- Form more clusters by joining the two closest clusters resulting in K-2 clusters.
- Repeat the above three steps until one big cluster is formed.
- Once a single cluster is formed, dendrograms are used to divide into multiple clusters depending upon the problem. We will study the concept of dendrogram in detail in an upcoming section.
There are different ways to find the distance between the clusters. The distance itself can be Euclidean or Manhattan distance. Following are some of the options to measure the distance between two clusters:
- Measure the distance between the closest points of two clusters.
- Find the distance between the farthest points of two clusters.
- Measure the distance between the centroids of two clusters.
- Find the distance between all possible combination of points between the two clusters and take the mean.
Code Implementation
We will implement the kmeans algorithm to visualise data to bucket it into different categories. We are using poker hand public data which is available here
Each record is an example of a hand consisting of five playing cards drawn from a standard deck of 52. Each card is described using two attributes (suit and rank), for a total of 10 predictive attributes. There is one Class attribute that describes the “Poker Hand”. The order of cards is important, which is why there are 480 possible Royal Flush hands as compared to 4!
We will be implementing the k-means algorithm using python and will be visualising the results in the end
Let us start by loading the required libraries for our task. We are using pandas and numpy for managing the data frame and mathematical calculations
# load libraries
from pandas import Series, DataFrame
import pandas as pd
import numpy as np
import matplotlib.pylab as plt
from sklearn.model_selection import train_test_split
from sklearn import preprocessing
from sklearn.cluster import KMeans
import urllib.request
from pylab import rcParams
rcParams['figure.figsize'] = 9, 8
Let us focus on the data preparation aspect of our implementation. We will be preparing our test and train data in this section. Train data is the one on which we will be performing the clustering process!
### Preparing the training data
url = "http://archive.ics.uci.edu/ml/machine-learning-databases/poker/poker-hand-training-true.data"
urllib.request.urlretrieve(url, "poker_train.csv")

url2 = "http://archive.ics.uci.edu/ml/machine-learning-databases/poker/poker-hand-testing.data"
urllib.request.urlretrieve(url2, "poker_test.csv")

# read the data in and add column names
data_train = pd.read_csv("poker_train.csv", header=None,names=['S1', 'C1', 'S2', 'C2', 'S3', 'C3','S4', 'C4', 'S5', 'C5', 'CLASS'])
data_test = pd.read_csv("poker_test.csv", header=None,names=['S1', 'C1', 'S2', 'C2', 'S3', 'C3','S4', 'C4', 'S5', 'C5', 'CLASS'])
Before proceeding with the segmentation, let us rescale our values within a certain range in order to bring all the numbers at the same scale. This helps in visualising different features on the same base.
cluster=data_train[['S1', 'C1', 'S2', 'C2', 'S3', 'C3','S4', 'C4', 'S5', 'C5']]
clustervar=cluster.copy() # create a copy
clustervar['S1']=preprocessing.scale(clustervar['S1'].astype('float64'))
clustervar['C1']=preprocessing.scale(clustervar['C1'].astype('float64'))
clustervar['S2']=preprocessing.scale(clustervar['S2'].astype('float64'))
clustervar['C2']=preprocessing.scale(clustervar['C2'].astype('float64'))
clustervar['S3']=preprocessing.scale(clustervar['S3'].astype('float64'))
clustervar['C3']=preprocessing.scale(clustervar['C3'].astype('float64'))
clustervar['S4']=preprocessing.scale(clustervar['S4'].astype('float64'))
clustervar['C4']=preprocessing.scale(clustervar['C4'].astype('float64'))
clustervar['S5']=preprocessing.scale(clustervar['S5'].astype('float64'))
clustervar['C5']=preprocessing.scale(clustervar['C5'].astype('float64'))
Also, before we start with clustering, we need to determine the number of clusters we are trying to identify. In most of the cases, you are looking for a particular k value for your k-means algorithm. If you select k=3, then the algorithm will try to find 3 different segments present in the data. In most of the cases, you will not be knowing the value of this k parameter. So how do you go about selecting the right “k” value for your model? The answer is “Elbow method”
The idea of the elbow method is to run k-means clustering on the dataset for a range of values of k, and for each value of k calculate the sum of squared errors (SSE).
Then, plot a line chart of the SSE for each value of k. If the line chart looks like an arm, then the “elbow” on the arm is the value of k that is the best. The idea is that we want a small SSE, but that the SSE tends to decrease toward 0 as we increase k (the SSE is 0 when k is equal to the number of data points in the dataset, because then each data point is its own cluster, and there is no error between it and the centre of its cluster). So our goal is to choose a small value of k that still has a low SSE, and the elbow usually represents where we start to have diminishing returns by increasing k
Let’s implement the elbow method to select our “k” value
clus_train = clustervar
from scipy.spatial.distance import cdist
clusters=range(1,11)
meandist=[]
# loop through each cluster and fit the model to the train set
# generate the predicted cluster assingment and append the mean distance my taking the sum divided by the shape
for k in clusters:
 model=KMeans(n_clusters=k)
 model.fit(clus_train)
 clusassign=model.predict(clus_train)
 meandist.append(sum(np.min(cdist(clus_train, model.cluster_centers_, 'euclidean'), axis=1))
 clus_train.shape[0])
plt.plot(clusters, meandist)
plt.xlabel('Number of clusters')
plt.ylabel('Average distance')
plt.title('Selecting k with the Elbow Method')
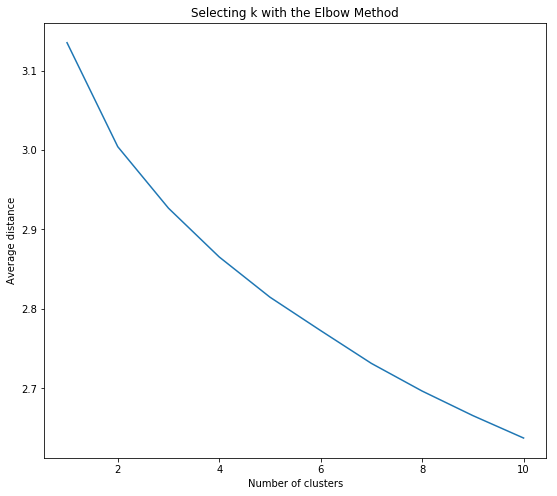
Observing the elbow method,k=2 and k=3 are more reasonable options for our segmentation analysis
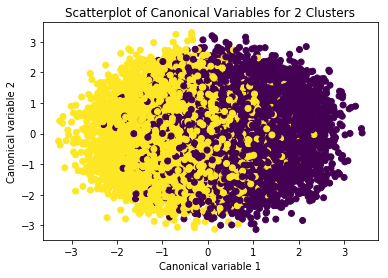
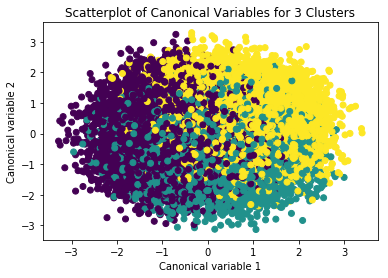
model3=KMeans(n_clusters=2)
model3.fit(clus_train)
# has cluster assingments based on using 3 clusters
clusassign=model3.predict(clus_train)
from sklearn.decomposition import PCA # CA from PCA function
pca_2 = PCA(2) # return 2 first canonical variables
plot_columns = pca_2.fit_transform(clus_train) # fit CA to the train dataset
plt.scatter(x=plot_columns[:,0], y=plot_columns[:,1], c=model3.labels_,)
# plot 1st canonical variable on x axis, 2nd on y-axis
plt.xlabel('Canonical variable 1')
plt.ylabel('Canonical variable 2')
# plt.zlabel('Canonical variable 3')
plt.title('Scatterplot of Canonical Variables for 2 Clusters')
plt.show()
Summary
In this blog, we implemented k-means clustering on poker hand dataset. Also, we understood about cluster analysis and different techniques in it. All the in-depth information was not covered in this blog, as it has been written for folks who are starting to explore data clustering in data science. Happy learning!!
Follow this link, if you are looking to learn data science online!
You can follow this link for our Big Data course!
Additionally, if you are having an interest in learning Data Science, click here to start the Online Data Science Course
Furthermore, if you want to read more about data science, read our Data Science Blogs
