Random forest is one of those algorithms which comes to the mind of every data scientist to apply on a given problem. It has been around for a long time and has successfully been used for such a wide number of tasks that it has become common to think of it as a basic need. It is a versatile algorithm and can be used for both regression and classification.
This post aims at giving an informal introduction of Random Forest and its implementation in R.
Table of contents
- What is a Decision Tree?
- What is Random Forest?
- Random forest in R.
- Pros and Cons?
- Applications
What is a Decision Tree?
Best Essay Writing Service: Reddit Users Testimonials
Decision tree is a simple, deterministic data structure for modelling decision rules for a specific classification problem. At each node, one feature is selected to make separating decision. We can stop splitting once the leaf node has optimally less data points. Such leaf node then gives us insight into the final result (Probabilities for different classes in case of classfication).
Refer the figure below for a clearer understanding:

How does it split?
The most decisive factor for the efficiency of a decision tree is the efficiency of its splitting process. We split at each node in such a way that the resulting purity is maximum. Well, purity just refers to how well we can segregate the classes and increase our knowledge by the split performed. An image is worth a thousand words. Have a look at the image below for some intuition:

Two popular methods for splitting are:
Explaining each of these methods in detail is beyond the scope of this post, but I highly recommend you to go through the given links for an in-depth understanding.
Visualization:
Each split leads to a straight line classifying the dataset into two parts. Thus, the final decision boundary will consist of straight lines (boxes).
- Each split leads to a straight line classifying the dataset into two parts. Thus, the final decision boundary will consist of straight lines (or boxes).

- In comparison to regression, a decision tree can fit a stair case boundary to classify data.

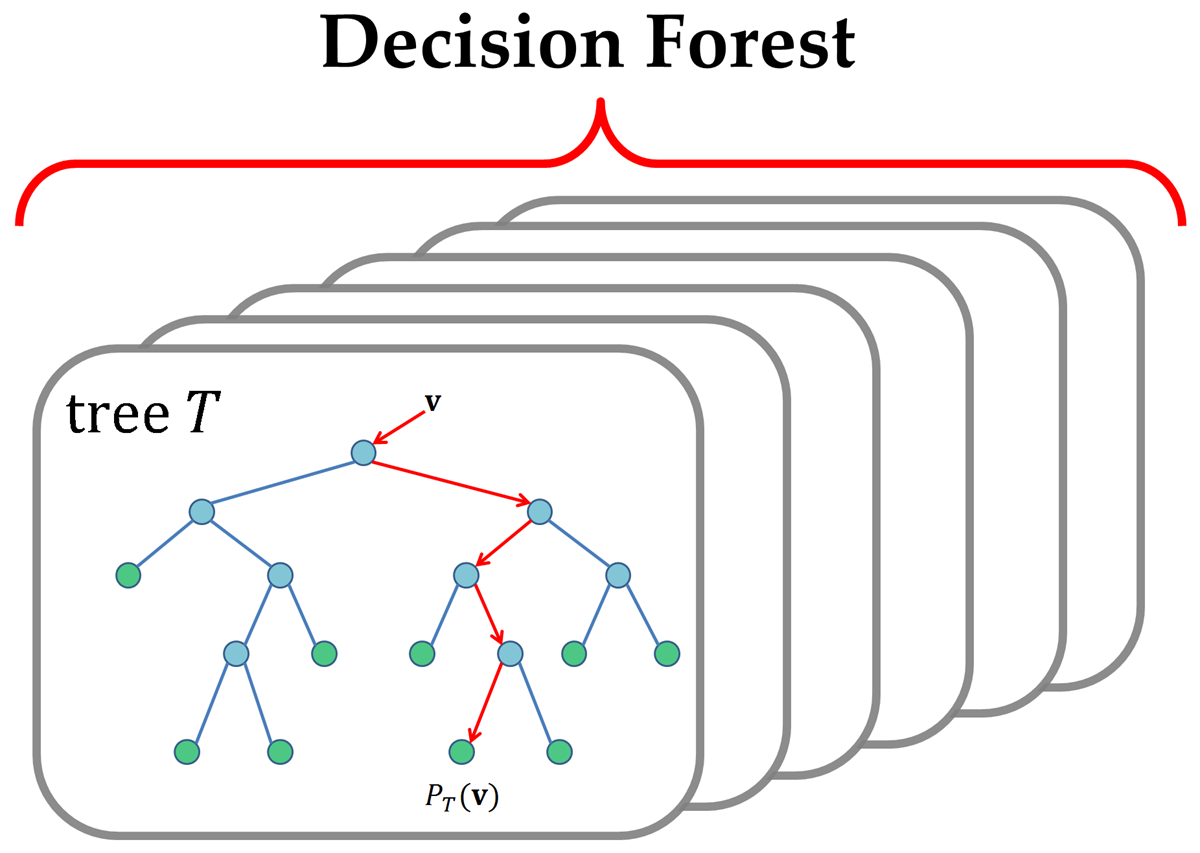
What is Random Forest?
Random forest is just an improvement over the top of the decision tree algorithm. The core idea behind Random Forest is to generate multiple small decision trees from random subsets of the data (hence the name “Random Forest”).
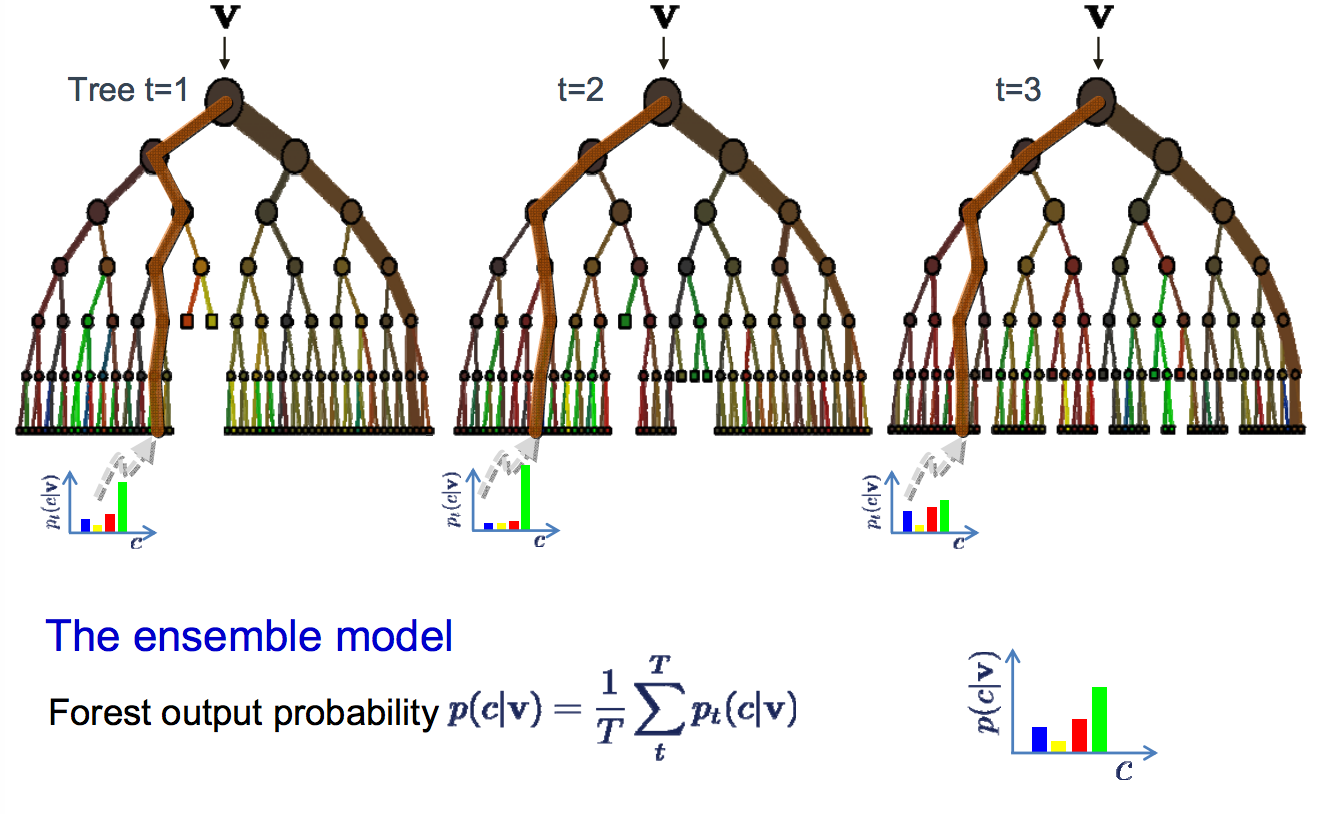
Each of the decision tree gives a biased classifier (as it only considers a subset of the data). They each capture different trends in the data. This ensemble of trees is like a team of experts each with a little knowledge over the overall subject but thourough in their area of expertise.
Now, in case of classification the majority vote is considered to classify a class. In analogy with experts, it is like asking the same multiple choice question to each expert and taking the answer as the one that most no. of experts vote as correct. In case of Regression, we can use the avg. of all trees as our prediction.In addition to this, we can also weight some more decisive trees high relative to others by testing on the validation data.
Visualization:
- Majority vote is taken from the experts (trees) for classification.

- We can also use probabilities and set the threshold for classification.
Major hyperparameters in Random Forest
- ntree : Number of trees to grow in the forest. Typical values is around 100. More trees sometimes leads to overfitting.
- mtry : Number of variables randomly sampled as candidates at each split for a particular tree.
- replace: Sampling shoud be done with or without replacement.
Decision boundary in Random Forest:
As Random Forest uses ensemble of trees, it is capable of generating complex decision boundaries. Below are the kinds of decision boundaries that Random Forest can generate:


Random forest in R.
#Random Forest in R using IRIS data
#Split iris data to Training data and testing data

ind <- sample(2,nrow(iris),replace=TRUE)
train <- iris[ind==1,]
test <- iris[ind==2,]
head(train, 3)
## Sepal.Length Sepal.Width Petal.Length Petal.Width Species
## 3 4.7 3.2 1.3 0.2 setosa
## 5 5.0 3.6 1.4 0.2 setosa
## 7 4.6 3.4 1.4 0.3 setosa#Try plotting how a decision tree for IRIS will look like
x <- ctree(Species ~ ., data = iris)
plot(x, type = "simple")
#Train a RF model
model <- randomForest(Species~., data=train , ntree=50, mtry = 2,proximity=TRUE)

#Print RF model details
print(model)
##
## Call:
## randomForest(formula = Species ~ ., data = train, ntree = 50, mtry = 2, proximity = TRUE)
## Type of random forest: classification
## Number of trees: 50
## No. of variables tried at each split: 2
##
## OOB estimate of error rate: 6.41%
## Confusion matrix:
## setosa versicolor virginica class.error
## setosa 25 0 0 0.00000000
## versicolor 0 24 2 0.07692308
## virginica 0 3 24 0.11111111#Plot error vs ntree for classes
plot(model)
#Use the value of ntree where error becomes constant#Plot variable importance matrix
varImpPlot(model)
#Test the model on testdata
pred <-predict(model , newdata=test)
table(pred, test$Species)
##
## pred setosa versicolor virginica
## setosa 25 0 0
## versicolor 0 23 1
## virginica 0 1 22#Plot the margin (positive -> correct classification)
plot(margin(model,test$Species))
#Search for optimal value of mtry for random forest

tune <- tuneRF(iris[,-5],iris[,5])
## mtry = 2 OOB error = 5.33%
## Searching left ...
## mtry = 1 OOB error = 5.33%
## 0 0.05
## Searching right ...
## mtry = 4 OOB error = 4.67%
## 0.125 0.05
I highly encourage you to play with the hyperparameters for a while and see their effect on the output. ***
Pros and Cons?
Pros:
- One of the most accurate decision models.
- Works well on large datasets.
- Can be used to extract variable importance.
- Do not require feature engineering (scaling and normalization)
Cons:
- Overfitting in case of noisy data.
- Unlike decision trees, results are difficult to interpret.
- Hyperparamters needs good tuning for high accuracy.
Applications
Random forests have successfully been implemented in a variety of fields. Some applications include:
- Object recognition.
- Molecular Biology (Analyzing amino acid sequences)
- Remote sensing (Pattern recognition)
- Astronomy (Star Galaxy classification, etc)
Additional resources:
I highly recommend you to go through the links below for an in-depth understanding of the Maths behind this algorithm.
// add bootstrap table styles to pandoc tables
function bootstrapStylePandocTables() {
$(‘tr.header’).parent(‘thead’).parent(‘table’).addClass(‘table table-condensed’);
}
$(document).ready(function () {
bootstrapStylePandocTables();
});
(function () {
var script = document.createElement(“script”);
script.type = “text/javascript”;
script.src = “https://cdn.mathjax.org/mathjax/latest/MathJax.js?config=TeX-AMS-MML_HTMLorMML”;
document.getElementsByTagName(“head”)[0].appendChild(script);
})();