Data scientists are one of the most hirable specialists today, but it’s not so easy to enter this profession without a “Projects” field in your resume. Furthermore, you need the experience to get the job, and you need the job to get the experience. Seems like a vicious circle, right? Also, the great advantage of data science projects is that each of them is a full-stack data science problem. Additionally, this means that you need to formulate the problem, design the solution, find the data, master the technology, build a machine learning model, evaluate the quality, and maybe wrap it into a simple UI. Hence, this is a more diverse approach than, for example, Kaggle competition or Coursera lessons.
Hence, in this blog, we will look at 10 projects to undertake in 2019 to learn data science and improve your understanding of different concepts.
Projects
1. Match Career Advice Questions with Professionals in the Field
Problem Statement: The U.S. has almost 500 students for every guidance counselor. Furthermore, youth lack the network to find their career role models, making CareerVillage.org the only option for millions of young people in America and around the globe with nowhere else to turn. Also, to date, 25,000 create profiles and opt-in to receive emails when a career question is a good fit for them. This is where your skills come in. Furthermore, to help students get the advice they need, the team at CareerVillage.org needs to be able to send the right questions to the right volunteers. The notifications for the volunteers seem to have the greatest impact on how many questions are answered.
Your objective: Develop a method to recommend relevant questions to the professionals who are most likely to answer them.
Problem Statement: In this competition, you must create an algorithm to identify metastatic cancer in small image patches taken from larger digital pathology scans. Also, the data for this competition is a slightly different version of the PatchCamelyon (PCam) benchmark dataset. PCam is highly interesting for both its size, simplicity to get started on, and approachability.
Your objective: Identify metastatic tissue in histopathologic scans of lymph node sections
Problem Statement: To assess the impact of climate change on Earth’s flora and fauna, it is vital to quantify how human activities such as logging, mining, and agriculture are impacting our protected natural areas. Furthermore, researchers in Mexico have created the VIGIA project, which aims to build a system for autonomous surveillance of protected areas. Moreover, the first step in such an effort is the ability to recognize the vegetation inside the protected areas. In this competition, you are tasked with the creation of an algorithm that can identify a specific type of cactus in aerial imagery.
Your objective: Determine whether an image contains a columnar cactus
Problem Statement: In a world, where movies made an estimate of $41.7 billion in 2018, the film industry is more popular than ever. But what movies make the most money at the box office? How much does a director matter? Or the budget? For some movies, it’s “You had me at ‘Hello. In this competition, you’re presented with metadata on over 7,000 past films from The Movie Database to try and predict their overall worldwide box office revenue. Also, the data points provided include cast, crew, plot keywords, budget, posters, release dates, languages, production companies, and countries. Furthermore, you can collect other publicly available data to use in your model predictions.
Your objective: Can you predict a movie’s worldwide box office revenue?
Problem Statement: An existential problem for any major website today is how to handle toxic and divisive content. Furthermore, Quora wants to tackle this problem head-on to keep their platform a place where users can feel safe sharing their knowledge with the world. On Quora, people can ask questions and connect with others who contribute unique insights and quality answers. A key challenge is to weed out insincere questions — those founded upon false premises, or that intend to make a statement rather than look for helpful answers.
In this competition, you need to develop models that identify and flag insincere questions. Moreover, to date, Quora has employed both machine learning and manual review to address this problem. With your help, they can develop more scalable methods to detect toxic and misleading content.
Your objective: Detect toxic content to improve online conversations
Problem Statement: This competition is provided as a way to explore different time series techniques on a relatively simple and clean dataset. You are given 5 years of store-item sales data and asked to predict 3 months of sales for 50 different items at 10 different stores. What’s the best way to deal with seasonality? Should stores be modelled separately, or can you pool them together? Does deep learning work better than ARIMA? Can either beat xgboost? Also, this is a great competition to explore different models and improve your skills in forecasting.
Your Objective: Predict 3 months of item sales at different stores
Problem Statement: This competition focuses on the problem of forecasting the future values of multiple time series, as it has always been one of the most challenging problems in the field. More specifically, we aim the competition at testing state-of-the-art methods designed by the participants, on the problem of forecasting future web traffic for approximately 145,000 Wikipedia articles. Also, the sequential or temporal observations emerge in many key real-world problems, ranging from biological data, financial markets, weather forecasting, to audio and video processing. Moreover, the field of time series encapsulates many different problems, ranging from analysis and inference to classification and forecast. What can you do to help predict future views?
Problem Statement: Forecast future traffic to Wikipedia pages
Problem Statement: What does physics have in common with biology, cooking, cryptography, diy, robotics, and travel? If you answer “all pursuits are under the immutable laws of physics” we’ll begrudgingly give you partial credit. Also, If you answer “people chose randomly for a transfer learning competition”, congratulations, we accept your answer and mark the question as solved.
In this competition, we provide the titles, text, and tags of Stack Exchange questions from six different sites. We then ask for tag predictions on unseen physics questions. Solving this problem via a standard machine approach might involve training an algorithm on a corpus of related text. Here, you are challenged to train on material from outside the field. Can an algorithm learn appropriate physics tags from “extreme-tourism Antarctica”? Let’s find out.
Your objective: Predict tags from models trained on unrelated topics
Problem Statement: MNIST (“Modified National Institute of Standards and Technology”) is the de facto “hello world” dataset of computer vision. Since its release in 1999, this classic dataset of handwritten images has served as the basis for benchmarking classification algorithms. As new machine learning techniques emerge, MNIST remains a reliable resource for researchers and learners alike. Furthermore, in this competition, your goal is to correctly identify digits from a dataset of tens of thousands of handwritten images.
Your objective: Learn computer vision fundamentals with the famous MNIST data
Problem Statement: The sinking of the RMS Titanic is one of the most infamous shipwrecks in history. On April 15, 1912, during her maiden voyage, the Titanic sank after colliding with an iceberg, killing 1502 out of 2224 passengers and crew. Furthermore, this sensational tragedy shocked the international community and led to better safety regulations for ships. Also, one of the reasons that the shipwreck led to such loss of life was that there were not enough lifeboats for the passengers and crew. Although there was some element of luck involved in surviving the sinking, some groups of people were more likely to survive than others, such as women, children, and the upper-class. In this challenge, we ask you to complete the analysis of what sorts of people were likely to survive.
Your objective: Predict survival on the Titanic and get familiar with ML basics
Data scientists are the no. 1 most promising job in America for 2019, according to a Thursday report from LinkedIn. Hence, this comes as no surprise: Data scientist topped Glassdoor’s list of Best Jobs in America for the past three years, with professionals in the field reporting high demand, high salaries, and high job satisfaction.
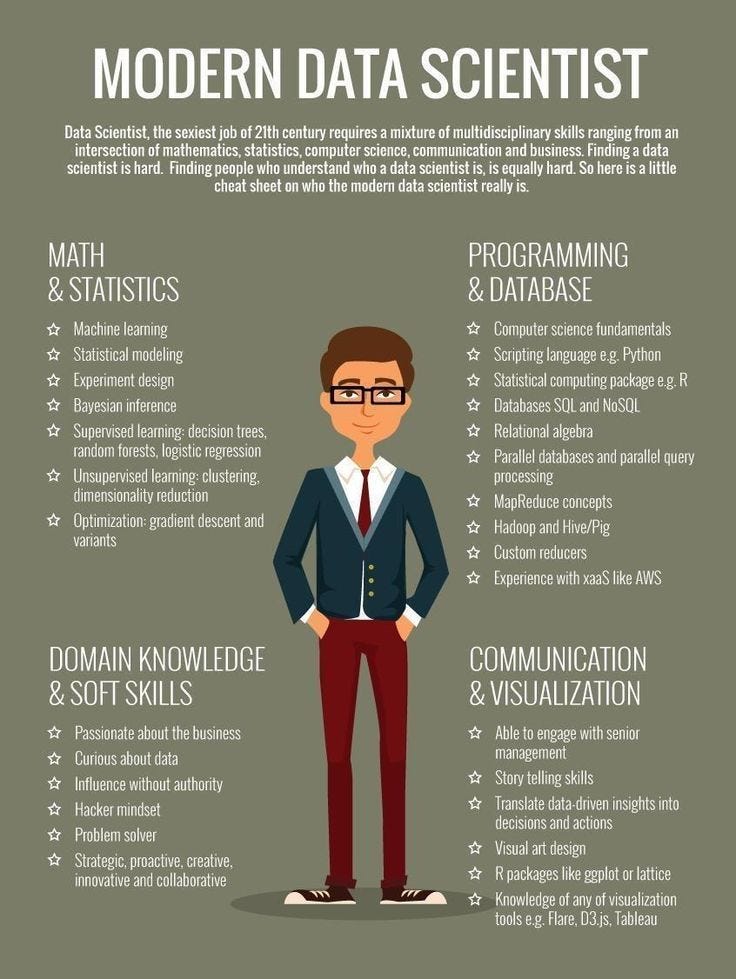
Also, with the increase in demand, employers are looking for more skills in modern day data scientists. Furthermore, a modern-day data scientist needs to be a good player in aspects like maths, programming, communication and problem-solving.
In this blog, we are going to explore if knowledge of mathematics is really necessary to become good data scientists. Also, we will try to explore ways, if any, through which one can become a good data scientist without learning maths.
What all it takes for a modern day Data Scientist
Data scientists continue to be in high demand, with companies in virtually every industry looking to get the most value from their burgeoning information resources. Additionally, this role is important, but the rising stars of the business are those savvy data scientists that have the ability to not only manipulate vast amounts of data with sophisticated statistical and visualization techniques but have a solid acumen from which they can derive forward-looking insights, Boyd says. Also, these insights help predict potential outcomes and mitigate potential threats to the business. Additionally, key skills of modern-day data scientists are as follows
Data scientists need to be critical thinkers, to be able to apply the objective analysis of facts on a given topic or problem before formulating opinions or rendering judgments. Also, they need to understand the business problem or decision being made and be able to ‘model’ or ‘abstract’ what is critical to solving the problem, versus what is extraneous and can be ignored.
2. Coding
Top-notch data scientists know how to write code and are comfortable handling a variety of programming tasks. Furthermore, to be really successful as a data scientist, the programming skills need to comprise both computational aspects — dealing with large volumes of data, working with real-time data, cloud computing, unstructured data, as well as statistical aspects — [and] working with statistical models like regression, optimization, clustering, decision trees, random forests, etc.
3. Math
Data science is probably not a good career choice for people who don’t like or are not proficient at mathematics. Moreover, the data scientist whiz is one who excels at mathematics and statistics while having an ability to collaborate closely with line-of-business executives to communicate what is actually happening in the “black box” of complex equations in a manner that provides reassurance that the business can trust the outcomes and recommendations
4. Machine learning, deep learning, AI
Industries are moving extremely fast in these areas because of increased computing power, connectivity, and huge volumes of data being collected. A data scientist needs to stay in front of the curve in research, as well as understand what technology to apply when. Also, too many times a data scientist will apply something ‘sexy’ and new when the actual problem they are solving is much less complex.
Data scientists need to have a deep understanding of the problem to be solved, and the data itself will speak to what’s needed. Furthermore, being aware of the computational cost to the ecosystem, interpretability, latency, bandwidth, and other system boundary conditions — as well as the maturity of the customer — itself, helps the data scientist understand what technology to apply. That’s true as long as they understand the technology.
5. Communication
The importance of communication skills bears repeating. Virtually nothing in technology today is performed in a vacuum; there’s always some integration between systems, applications, data and people. Data science is no different, and being able to communicate with multiple stakeholders using data is a key attribute.
6. Data architecture
It is imperative that the data scientist understands what is happening to the data from inception to model to a business decision. Additionally, to not understand the architecture can have a serious impact on sample size inferences and assumptions, often leading to incorrect results and decisions.
As we have seen, mathematics is a crucial skill of a data scientist among many others. Agreed it is not everything that a data scientist may require. Hence, we will explore more on the usage of mathematics in data science. Also, this will help us to answer our question better!
Application of maths in data science and AI
Modelling a process (physical or informational) by probing the underlying dynamics
Constructing hypotheses
Rigorously estimating the quality of the data source
Quantifying the uncertainty around the data and predictions
Identifying the hidden pattern from the stream of information
Understanding the limitation of a model
Understanding mathematical proof and the abstract logic behind it
What all Maths You Must Know?
1. Linear algebra
You need to be familiar with linear algebra if you want to work in data science and machine learning because it helps deal with matrices — mathematical objects consisting of multiple numbers organised in a grid. Also, the data collected by a data scientist naturally comes in the form of a matrix — the data matrix — of n observations by p features, thus an n-by-p grid.
2. Probability theory
Probability theory — even the basic, not yet measure-theoretic probability theory — helps the data scientist deal with uncertainty and express it in models. Frequentists, Bayesian, and indeed quantum physicists argue to this day what probability really is (in many languages, such as Russian and Ukrainian, the word for probability comes from “having faith”), whereas pragmatists, such as Andrey Kolmogorov, shirk the question, postulate some axioms that describe how probability behaves (rather than what it is) and say: stop asking questions, just use the axioms.
3. Statistics
After probability theory, there comes statistics. As Ian Hacking remarked, “The quiet statisticians have changed our world — not by discovering new facts or technical developments, but by changing the ways that we reason, experiment, and form opinions”. Read Darrell Huff’s How to Lie with Statistics — if only to learn how to be truthful and how to recognise the truth — just as Moses learned “all the wisdom of the Egyptians” — in order to reject it.
4. Estimation theory
A particular branch of statistics — estimation theory — had been largely neglected in mathematical finance, at a high cost. It tells us how well we know a particular number: what is the error present in our estimates? How much of it is due to bias and how much due to variance?
Also, going beyond classical statistics, in machine learning, we want to minimise the error on new data — out-of-sample — rather than on the data that we have already seen — in-sample. As someone remarked, probably Niels Bohr or Piet Hein, “prediction is very difficult, especially about the future.”
5. Optimization theory
You can spend a lifetime studying this. Much of machine learning is about optimization — we want to find the weights that give the best (in optimisation speak, optimal) performance of a neural network on new data, so naturally, we have to optimise — perhaps with some form of regularisation. (And before you have calibrated that long short-term memory (LSTM) network — have you tried the basic linear regression on your data?)
What you miss on skipping Maths?
No in-depth knowledge of working of ML models
Inability to prove the correctness of your hypothesis
Prone to introducing bias and errors in your analysis
Inefficiency in math-heavy business problems
Some resources to learn maths online
We will divide the resources to 3 sections (Linear Algebra, Calculus, Statistics and probability), the list of resources will be in no particular order, resources are diversified between video tutorials, books, blogs, and online courses.
Linear Algebra
Used in machine learning (& deep learning) to understand how algorithms work under the hood. Basically, it’s all about vector/matrix/tensor operations, no black magic is involved!
Used in machine learning (&deep learning) to formulate the functions used to train algorithms to reach their objective, known by loss/cost/objective functions.
Linear algebra, calculus II, stats and probability are sufficient for understanding and handle 90% of machine learning models. Also, some areas and methods require special insights, for example, Bayesian and variational method require a calculus of variation, MCMC and Gibbs sample require advanced concepts of probability theory, information geometry and submanifolds learning to require differential geometry, kernel theory requires calculus III. Lately, it seems that even abstract algebra is playing a role.
Aditionally, not knowing maths may help you in reaching low-level positions in data science or solving some dummy projects. But in the long run, it will be maths only which will help you in scaling your career up!
Follow this link, if you are looking to learn more about data science online!
Technology has become the embedded component of applications and the defacto driver for growth in industries. With the advent of AI, new milestones are being achieved each day. We are moving towards an era of more and more integration, making it an indispensable mediator between systems and humans. The rapid strides taken by the mobile industry seems like an overwhelming convergence of multiple worlds. The innate ability of such systems to improve itself, strengthened by data analytics, IoT and AI have opened new frontiers. To reap the unbound merits of AI, software application vendors are integrating it into software applications.
In this blog, we will understand what exactly are these intelligent apps. What all does it require to make an intelligent app? Also, we will look into the real world applications of these intelligent apps.
What are Intelligent Applications?
So what exactly are intelligent apps? These are apps that not only know how to support key user decisions but also learn from user interactions. These apps aim to become even more relevant and valuable to these users.
In other words, intelligent apps are those that also learn and adapt and can even act on their own. Much like all of us, these apps learn and change behaviour. We are already seeing this at work. Have you noticed how e-commerce websites show you the right recommendations at the right time?
Intelligent apps are becoming a thing thanks to the strides being made in Artificial Intelligence (AI) and Machine Learning. Machine learning gives systems the ability to learn and improve from experience without being specifically programmed. There is an increase in the popularity of conversational systems and the growth of the Internet of Things. Therefore, we are seeing machine learning applied to more things in our everyday life.
Using AI algorithms, intelligent apps can study users’ behaviour and choices. Furthermore, it can sort through this data to use the relevant information to predict your needs and act on your behalf. For example, Smart Reply enables you to quickly respond to emails by giving you auto-generated replies. Productivity apps like Microsoft Office 365 and Google’s G Suite also use AI. Chatbots such as Meziuse machine learning to study user’s behaviour and provide them with choices they would like.
Features of Intelligent Applications
1. Data-driven
Intelligent apps combine and process multiple data sources — such as IoT sensors, beacons or user interactions — and turn an enormous quantity of numbers into valuable insights.
2. Contextual and relevant
Intelligent apps make much smarter use of a device’s features to proactively deliver highly relevant information and suggestions. Users will no longer have to go to their apps. Instead, the apps will come to them.
3. Continuously adapting
Through machine learning, intelligent apps continuously adapt and improve their output.
4. Action-oriented
By anticipating user behaviours with predictive analytics, smart applications deliver personalized and actionable suggestions.
5. Omnichannel
Progressive web applications are increasingly blurring the lines between native apps and mobile web applications.
Applications
1. Health Care Benefits
We are exploring AI/ML technology for health care. It can help doctors with diagnoses and tell when patients are deteriorating so medical intervention can occur sooner before the patient needs hospitalization. It’s a win-win for the healthcare industry, saving costs for both the hospitals and patients. The precision of machine learning can also detect diseases such as cancer sooner, thus saving lives.
2. Intelligent Conversational Interfaces
We are using machine learning and AI to build intelligent conversational chatbots and voice skills. These AI-driven conversational interfaces are answering questions from frequently asked questions and answers, helping users with concierge services in hotels, and to provide information about products for shopping. Advancements in the deep neural network or deep learning are making many of these AI and ML applications possible
3. Market Prediction
We are using AI in a number of traditional places like personalization, intuitive workflows, enhanced searching and product recommendations. More recently, we started baking AI into our go-to-market operations to be first to market by predicting the future. Or should I say, by “trying” to predict the future?
4. Customer Lifetime Value Modeling
Customer lifetime value models are among the most important for eCommerce business to employ. That’s because they can be used to identify, understand, and retain your company’s most valuable customers, whether that means the biggest spenders, the most loyal advocates of your brand, or both. These models predict the future revenue that an individual customer will bring to your business in a given period. With this information, you can focus your marketing efforts to encourage these customers to interact with your brand more often and even target your acquisition spend to attract new customers that are similar to your existing MVPs.
5. Churn Modeling
Customer churn modelling can help you identify which of your customers are likely to stop engaging with your business and why. The results of a churn model can range from churn risk scores for individual customers to drivers of churn ranked by importance. These outputs are essential components of an algorithmic retention strategy because they help optimize discount offers, email campaigns, or other targeted marketing initiatives that keep your high-value customer’s buying.
6. Dynamic Pricing
Dynamic pricing, also known as demand pricing, is the practice of flexible pricing items based on factors like the level of interest of the target customer, demand at the time of purchase, or whether the customer has engaged with a marketing campaign. This requires a lot of data about how different customers’ willingness to pay for a good or service changes across a variety of situations, but companies like airlines and ride-share services have successfully implemented dynamic price optimization strategies to maximize revenue.
7. Customer Segmentation
Data scientists do not rely on intuition to separate customers into groups. They use clustering and classification algorithms to group customers into personas based on specific variations among them. These personas account for customer differences across multiple dimensions such as demographics, browsing behaviour, and affinity. Connecting these traits to patterns of purchasing behaviour allows data-savvy companies to roll out highly personalized marketing campaigns. Additionally, these campaigns are more effective at boosting sales than generalized campaigns.
8. Image Classification
Image classification uses machine learning algorithms to assign a label from a fixed set of categories to an image that’s inputted. It has a wide range of business applications including modelling 3D construction plans based on 2D designs, social media photo tagging, informing medical diagnoses, and more. Deep learning methods such as neural networks are often used for image classification because they can most effectively identify relevant features of an image in the presence of potential complications like the variation in the point of view, illumination, scale, or volume of clutter in the image.
9. Recommendation Engines
Recommendation engines are another major way machine learning proves its business value. In fact, Netflix values the recommendation engine powering its content suggestions at $1 billion per year and Amazon says its system drives a 20–35% lift in sales annually. That’s because recommendation engines sift through large quantities of data to predict how likely any given customer is to purchase an item or enjoy a piece of content and then suggest those things to the user. The result is a customer experience that encourages better engagement and reduces churn.
Examples
1. Email Filters in Gmail
Google uses AI to ensure that nearly all of the email landing in your inbox is authentic. Their filters attempt to sort emails into the following categories like primary, social, promotions, updates, forums and spam. The program helps your emails get organized so you can find your way to important communications quicker.
2. LinkedIn
AI is used to help match candidates to jobs with the hopes of creating better employee-employer matches.
On its talent blog, LinkedIn explains that they use “deeper insights into the behaviour of applicants on LinkedIn” in order to “predict not just who would apply to your job, but who would get hired…”
3. Google Predictive Searches
When you begin typing a search term and Google makes recommendations for you to choose from, that’s AI in action. Predictive searches are based on data that Google collects about you, such as your location, age, and other personal details. Using AI, the search engine attempts to guess what you might be trying to find.
4. Tesla Smart Cars
Talking about the AI, there is no better and more prominent display of this technology than what smart car and drone manufacturers are doing with it. Just a few years back, using a fully automatic car was a dream, however, now companies like Tesla have made so much progress that we already have a fleet of semi-automatic cars on the road.
5. Online Ads Network(Facebook/Microsoft/Google)
One of the biggest users of artificial intelligence is the online ad industry which uses AI to not only track user statistics but also serve us ads based on those statistics. Without AI, the online ad industry will just fail as it would show random ads to users with no connection to their preferences what so ever. AI has become so successful in determining our interests and serving us ads that the global digital ad industry has crossed 250 billion US dollars with the industry projected to cross the 300 billion mark in 2019. So next time when you are going online and seeing ads or product recommendation, know that AI is impacting your life.
6. Amazon Product Recommendations
Amazon and other online retailers use AI to gather information about your preferences and buying habits. Then, they personalize your shopping experience by suggesting new products tailored to your habits.
When you search for an item such as “Bose headsets,” the search engine also shows related items that other people have purchased when searching for the same product.
Current trends and explorations
Intelligent things are poised to be one of the important trends that have the potential for ‘disruption’ and large-scale impact across industries. According to Gartner, the future will see the utilization of AI by almost all apps and services, making these apps discreet yet useful and intelligent mediators between systems and humans. AI will be incorporated into various systems and apps in some way and is poised to become the key enabler across a variety of services and software systems. As mentioned at the Google conference, very fast, we are moving from mobile-first to AI-first world.
It won’t be an exaggeration to say that all the new applications built in the coming years will be intelligent apps. These apps use machine learning and historical as well as real-time data to make smart decisions and deliver a highly personalized experience to the users. These apps combine predictive and prescriptive analytics, customer data, product insights, and operational vision with contemporary user-focused design and application development tools to create a highly impactful experience for users.
The intelligent apps undoubtedly have the potential to change the face of work and structure at companies in the coming years. According to Gartner’s prediction, companies will increasingly use and develop intelligent apps and utilize analytics and big data to enhance their business processes and offer top class customer experiences.
Summary
As companies are charting their digital transformation initiatives, they need to add intelligent apps to their blueprint. The development of the right intelligent apps needs to consider the new growth areas, internal and external data sources, real-time data acquisition, processing, and analysis and putting the right technology to use.
Intelligent apps are undoubtedly paving the way for speedier business decisions, better business results, greater efficiency of the workforce, and long-term gains for all — they just need to be utilized right. Companies which are diving in intelligent apps now will have a considerable competitive advantage in the near future.
Follow this link, if you are looking to learn more about data science online!
In computer science, Decision tree learning uses a decision tree (as a predictive model) to go from observations about an item to conclusions about the item’s target value. It is one of the predictive modelling approaches used in statistics, data mining and machine learning. Tree models where the target variable can take a discrete set of values are called classification trees and where the target variable can take continuous values (typically real numbers) are called regression trees.
In this blog, we will use decision trees to solve the churn problem for a telephonic service provider, Telco! The goal of this blog is about building a decision tree classifier. Furthermore, we will look at some metrics in the end in order to evaluate the performance of our decision tree model.
What is Customer Churn?
Churn is defined slightly differently by each organization or product. Generally, the customers who stop using a product or service for a given period of time are referred to as churners. As a result, churn is one of the most important elements in the Key Performance Indicator (KPI) of a product or service. A full customer lifecycle analysis requires taking a look at retention rates in order to better understand the health of the business or product.
From a machine learning perspective, churn can be formulated as a binary classification problem. Although there are other approaches to churn prediction (for example, survival analysis), the most common solution is to label “churners” over a specific period of time as one class and users who stay engaged with the product as the complementary class.
What is a Decision Tree?
Decision trees, one of the simplest and yet most useful Machine Learning structures. Decision trees, as the name implies, are trees of decisions.
You have a question, usually a yes or no (binary; 2 options) question with two branches (yes and no) leading out of the tree. You can get more options than 2, but for this article, we’re only using 2 options.
Trees are weird in computer science. Instead of growing from a root upwards, they grow downwards. Think of it as an upside down tree.
The top-most item, in this example, “Am I hungry?” is called the root. It’s where everything starts. Branches are what we call each line. A leaf is everything that isn’t the root or a branch.
Trees are important in machine learning as not only do they let us visualise an algorithm, but they are a type of machine learning.
Telco Customer Churn Problem Statement
Teleco is looking to predict behaviour to retain customers for their product. You can analyze all relevant customer data and develop focused customer retention programs.
Each row in the data represents a customer, each column contains customer’s attributes described in the column Metadata.
The data set includes information about:
Customers who left within the last month — the column is called Churn
Services that each customer has signed up for — phone, multiple lines, internet, online security, online backup, device protection, tech support, and streaming TV and movies
Customer account information — how long they’ve been a customer, contract, payment method, paperless billing, monthly charges, and total charges
Demographic info about customers — gender, age range, and if they have partners and dependents
1. Data Exploration
In this step, we will focus more on understanding data at hand. Before directly jumping to any modelling approach, one must understand the data at hand. We will look at different features/columns present in the data. We will also try to understand what every column relates too in the context of the Telco churn problem.
2. Data Preprocessing There are very rare chances that data available at hand is directly applicable for building ML models. There can be multiple issues with data before you can even start implementing any fancy algorithm. Some of the issues can be missing values, improper format, the presence of categorical variables etc. We need to handle such issues then only we can train machine learning models. In our case of churn prediction, you can actually see our approach of handling missing data and categorical variables.
3. Training a decision tree classifier In this section, we will fit a decision tree classifier on the available data. The classifier learns the underlying pattern present in the data and builds a rule-based decision tree for making predictions. In this section, we are focussing more on the implementation of the decision tree algorithm rather than the underlying math. But, we will cover some basic math behind it for your better understanding while implementing the decision tree algorithm. Also, you can read about the decision trees in detail here!
4. Model Evaluation In this section, we will use our classifier to predict whether a customer will stop using the services of Telco or not. We will be looking at some of the methods like confusion matrix, AUC value and ROC-curve etc to evaluate the performance of our decision tree classifier.
Implementation in Python
We start by importing all the basic libraries and the data for training the decision tree algorithm. We are using numpy and pandas for performing mathematical operations and managing data in form of tables respectively.
import numpy as np # linear algebra
import pandas as pd # data processing, CSV file I/O (e.g. pd.read_csv)
import matplotlib.pyplot as plt # this is used for the plot the graph
import seaborn as sns # used for plot interactive graph.
import warnings
warnings.filterwarnings("ignore")
from pylab import rcParams
%matplotlib inline
data = pd.read_csv('./telco-churn.csv')
You can see the columns in the data below
######################### RESULT ###################################
Customer ID contains no specific information about any customer hence we need to drop this column from our dataset
data=data.drop(['customerID'], axis=1)
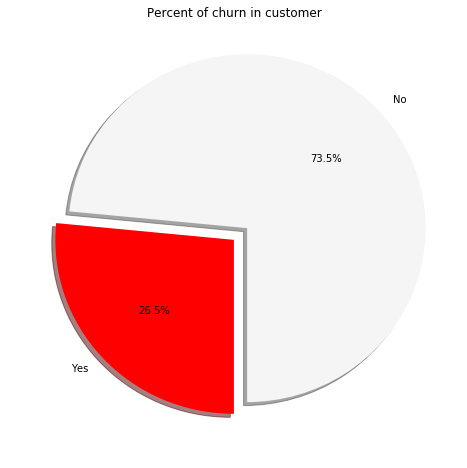
Now, let us have a look at our target variable. Here the target variable is “Churn” i.e. if a customer is going to stop using the services of Telco or not. We can see the proportion of the people opting out of the Telco services (churners) through the following code. It builds a simple pie chart to show the distribution of two classes in the dataset.
# Data to plot for the % of target variable
labels =data['Churn'].value_counts(sort = True).index
sizes = data['Churn'].value_counts(sort = True)
colors = ["whitesmoke","red"]
explode = (0.1,0)  # explode 1st slice

rcParams['figure.figsize'] = 8,8
# Plot
plt.pie(sizes, explode=explode, labels=labels, colors=colors,
        autopct='%1.1f%%', shadow=True, startangle=270,)
plt.title('Percent of churn in customer')
plt.show()
W can see through the pie chart, that 26.5% of customers present in the dataset are actually the churners i.e the people who opt out of the Telco services. The two target variables have a class imbalance in this case. No is present 73.5% of the times whereas yes is present only 26.5% of the times. In order to have a good machine learning model, we need to have a balance of the classes say 50% of both the class or in general, equal representation of the classes in the target variable.
There are techniques to manage the imbalanced classes like SMOTE but this is beyond the scope of this article for now. Decision trees can handle some imbalance present in the data better than other algorithms hence, we will not be using any technique to obtain balanced classes.
Finally, we need to convert yes/no of the target variable to 0 or 1. Machine learning models do not understand categorical variables. They need numbers to implement the underlying algorithms. Hence, our task in the data processing stage is to convert all the categorical variables to numbers.
# Converting the target class to 1’s and 0's
data['Churn'] = data['Churn'].map(lambda s :1  if s =='Yes' else 0)
Preprocessing Gender
In this section, we are processing the gender column to convert the categorical values into values. Pandas provide a get_dummies() function which can help you to convert your categorical column to a numeric one. It does one hot encoding of the values present in the column.
data['gender'].unique()
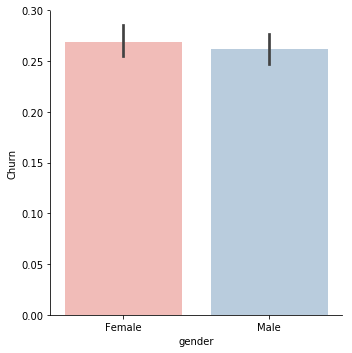
g = sns.factorplot(y="Churn",x="gender",data=data,kind="bar" ,palette = "Pastel1")
data = pd.get_dummies(data=data, columns=['gender'])
In this case, males and females have the same proportion of churning hence this variable is not informative enough to tell if a customer is going to stop using the services of Telco or not
Preprocessing Partner column
Partner columns contain a single yes/no. When there are only two categorical values present, we can directly replace the categories with 1 and 0. In case of more than two categorical variables, it is better to switch to one hot encoding of the values.
data['Partner'] = data['Partner'].map(lambda s :1 if s =='Yes' else 0)
Processing dependents, phone service and paperless billing variables
Above columns also contain only two categorical values. The following code assigns these categories a numeric 1/0 based on the respective category
data['Dependents'] = data['Dependents'].map(lambda s :1  if s =='Yes' else 0)
data['PhoneService'] = data['PhoneService'].map(lambda s :1  if s =='Yes' else 0)
data['PaperlessBilling'] = data['PaperlessBilling'].map(lambda s :1  if s =='Yes' else 0)
Analysing the number of months a person has stayed in the company
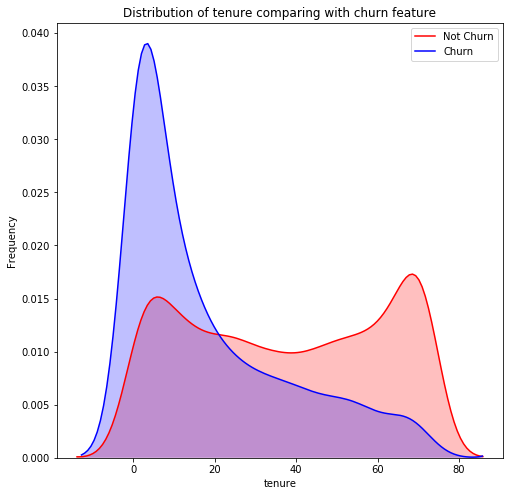
Let us analyse the number of months variable in order to understand the churn of the customers. We are plotting a distribution chart using the seaborn library in python through the following code!
# tenure distibution
g = sns.kdeplot(data.tenure[(data["Churn"] == 0) ], color="Red", shade = True)
g = sns.kdeplot(data.tenure[(data["Churn"] == 1) ], ax =g, color="Blue", shade= True)
g.set_xlabel("tenure")
g.set_ylabel("Frequency")
plt.title('Distribution of tenure comparing with churn feature')
g = g.legend(["Not Churn","Churn"])
We can clearly observe that most numbers of customers leave before 20 months. Once a customer has stayed with Telco for more than 20 months, it is highly unlikely that he is going to stop using the services provided by the Telco
Handling the telephone lines variable
Converting telephone line variable into dummy values
data['MultipleLines'].replace('No phone service','No', inplace=True)
data['MultipleLines'] = data['MultipleLines'].map(lambda s :1  if s =='Yes' else 0)
Preprocessing Customer Service variable
Converting customer service variable into dummy values
data['Has_InternetService'] = data['InternetService'].map(lambda s :0  if s =='No' else 1)
data['Fiber_optic'] = data['InternetService'].map(lambda s :1  if s =='Fiber optic' else 0)
data['DSL'] = data['InternetService'].map(lambda s :1  if s =='DSL' else 0)
data['OnlineSecurity'] = data['OnlineSecurity'].map(lambda s :1  if s =='Yes' else 0)
data['OnlineBackup'] = data['OnlineBackup'].map(lambda s :1  if s =='Yes' else 0)
data['DeviceProtection'] = data['DeviceProtection'].map(lambda s :1  if s =='Yes' else 0)
data['TechSupport'] = data['TechSupport'].map(lambda s :1  if s =='Yes' else 0)
data['StreamingTV'] = data['StreamingTV'].map(lambda s :1  if s =='Yes' else 0)
data['StreamingMovies'] = data['StreamingMovies'].map(lambda s :1  if s =='Yes' else 0)
Preprocessing payment and contract variables
data = pd.get_dummies(data=data, columns=['PaymentMethod'])
data = pd.get_dummies(data=data, columns=['Contract'])
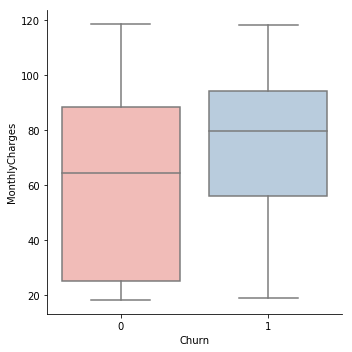
Analysing monthly and total charges
In this section, we will analyse the total and monthly charges column to understand their effect on the churning of the customers. Below code outputs a box plot based on the monthly charges between the customers who have left using the services and those who have not.
g = sns.factorplot(x="Churn", y = "MonthlyCharges",data = data, kind="box", palette = "Pastel1")
The high monthly charge is one cause for customers opting out of the services. The box plot also suggests that that loyal customers are those who have a low monthly charge.
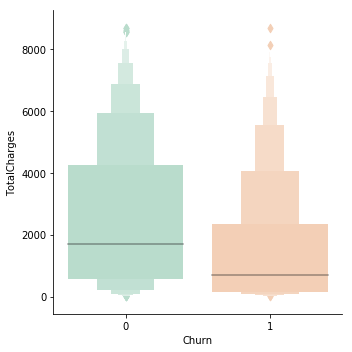
data['TotalCharges'] = pd.to_numeric(data['TotalCharges'])
g = sns.factorplot(y="TotalCharges",x="Churn",data=data,kind="boxen", palette = "Pastel2")
Modeling
In this section, we are building our decision tree classifier. Decision tree algorithm has been implemented in the sklearn package and it provides an interface to invoke that algorithm.
We first separate out the target variables from the rest of our features present in the data. Following code performs this task
After that, we import the decision tree algorithm from the sklearn package. We pass the training data and the target data separately so that the algorithm can understand the input and create a rule-based mapping to the output in the form of a decision tree.
from sklearn import tree
# Initialize our decision tree object
classification_tree = tree.DecisionTreeClassifier(max_depth=4)
# Train our decision tree (tree induction + pruning)
classification_tree = classification_tree.fit(X_train, Y_train)
We can also visualise the trained decision tree in the previous step using the below code. Branches represent the actions while the internal nodes represent a decision. Leaf nodes represent the final target variables i.e whether a customer is churning or not (1/0)
Before we move on to the evaluation of our algorithm, let us quickly test the accuracy of our model by making some predictions. Below code makes some predictions on the test data. We are using cross-validation here in order to avoid bias while testing the model for accuracy.
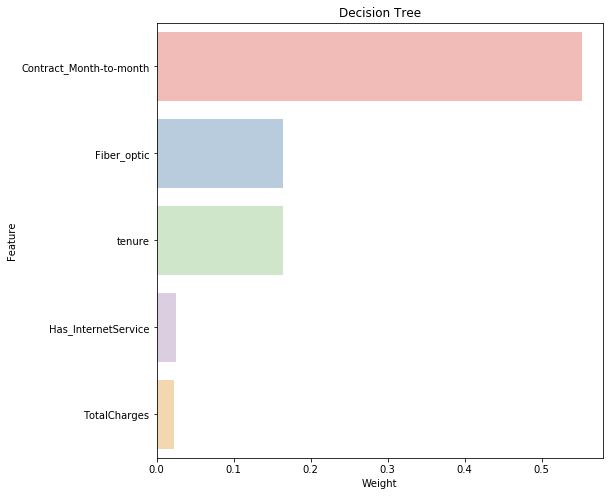
One great aspect of rule-based learning is that we can actually visualise how important a given feature is towards predicting our target variable. Below code forms a chart showing the relative importance of the features present in the data towards the prediction of our target churn class.
In order to evaluate our classification model, we are using the confusion matrix. A confusion matrix is a table that is often used to describe the performance of a classification model (or “classifier”) on a set of test data for which the true values are known.
You can read more about the confusion matrix here.
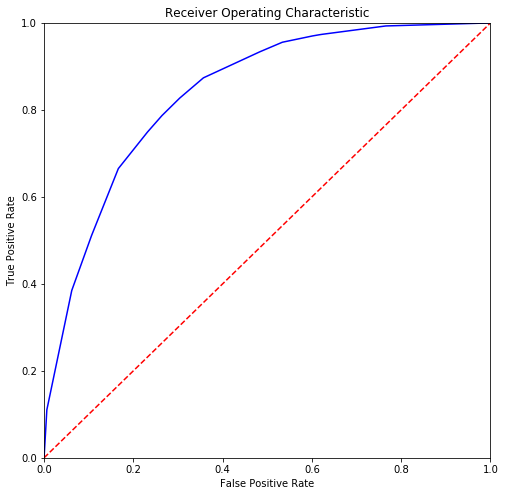
Following code generates the ROC curve for the predictions performed by our decision tree classifier. More the area under the ROC curve, better the prediction capability of the decision tree classifier.
from sklearn.metrics import roc_curve
# Calculate the fpr and tpr for all thresholds of the classification
fpr, tpr, threshold = roc_curve(Y_train, probs[:,1])
plt.title('Receiver Operating Characteristic')
plt.plot(fpr, tpr, 'b')
plt.plot([0, 1], [0, 1],'r--')
plt.xlim([0, 1])
plt.ylim([0, 1])
plt.ylabel('True Positive Rate')
plt.xlabel('False Positive Rate')
plt.show()
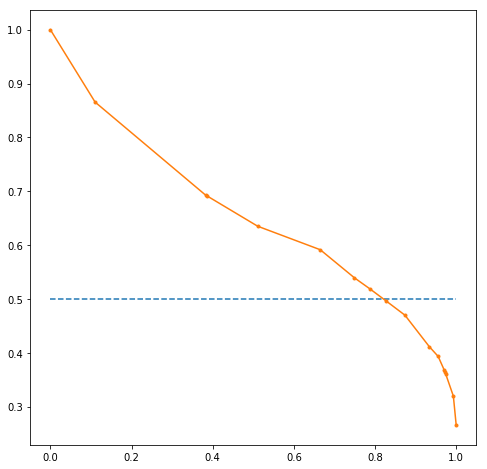
Below code makes a precision vs recall curve on the basis of the predictions. A precision-recall curve is a better indicator of the model performance than the ROC curve in case of imbalance in the target variable.
from matplotlib import pyplot
from sklearn.metrics import precision_recall_curve
precision, recall, thresholds = precision_recall_curve(Y_train, probs[:,1])
# plot no skill
pyplot.plot([0, 1], [0.5, 0.5], linestyle='--')
# plot the roc curve for the model
pyplot.plot(recall, precision, marker='.')
Summary
In this blog, we covered building a decision tree classifier for a sample use case. Decision trees can be a great platform to plant your footsteps in the world of machine learning as they are easier to implement and interpret. Also, we made some predictions using our decision tree classifier and evaluated its performance. The scope of this article was to familiarise the readers with decision trees and it’s an implementation for a use case!
For the next steps, you can also look at the Random Forest algorithm, which is nothing but a collection of different decision trees together making predictions. You can read more about the random forest here.
Follow this link, if you are looking to learn more about data science online!
With the growth of Data science in recent years, we have seen a growth in the development of the tools for it. R and Python have been steady languages used by people worldwide. But before R and Python, there was only one key player and it was MATLAB. MATLAB is still in usage in most of the academics areas and mostly all the researchers throughout the world use MATLAB.
In this blog, we will look at the reasons why MATLAB is a good contender to R and Python for Data science. Furthermore, we will discuss different courses which offer data science with MATLAB.
What is MATLAB?
MATLAB is a high-performance language for technical computing. It integrates computation, visualization, and programming in an easy-to-use environment where problems and solutions are expressed in familiar mathematical notation.
It is a programming platform, specifically for engineers and scientists. The heart of MATLAB is the MATLAB language, a matrix-based language allowing the most natural expression of computational mathematics.
Typical uses include:
Math and computation
Algorithm development
Modelling, simulation, and prototyping
Data analysis, exploration, and visualization
Scientific and engineering graphics
Application development, including Graphical User Interface building
The language, apps, and built-in math functions enable you to quickly explore multiple approaches to arrive at a solution. MATLAB lets you take your ideas from research to production by deploying to enterprise applications and embedded devices, as well as integrating with Simulink® and Model-Based Design.
Features of MATLAB
Following are the basic features of MATLAB −
It is a high-level language for numerical computation, visualization and application development
Provides an interactive environment for iterative exploration, design and problem-solving.
Holds a vast library of mathematical functions for linear algebra, statistics, Fourier analysis, filtering, optimization, numerical integration and solving ordinary differential equations.
It provides built-in graphics for visualizing data and tools for creating custom plots.
MATLAB’s programming interface gives development tools for improving code quality maintainability and maximizing performance.
It provides tools for building applications with custom graphical interfaces.
It provides functions for integrating MATLAB based algorithms with external applications and languages such as C, Java, .NET and Microsoft Excel.
Why Use MATLAB in Data Science?
Physical-world data: MATLAB has native support for the sensor, image, video, telemetry, binary, and other real-time formats. Explore this data using MATLAB MapReduce functionality for Hadoop, and by connecting interfaces to ODBC/JDBC databases.
Machine learning, neural networks, statistics, and beyond: MATLAB offers a full set of statistics and machine learning functionality, plus advanced methods such as nonlinear optimization, system identification, and thousands of prebuilt algorithms for image and video processing, financial modelling, control system design.
High-speed processing of large data sets. MATLAB’s numeric routines scale directly to parallel processing on clusters and cloud.
Online and real-time deployment: MATLAB integrates into enterprise systems, clusters, and clouds, and can be targeted to real-time embedded hardware.
Also, MATLAB finds its features available for the entire data science problem-solving journey. Let us have a look at how MATLAB fits in every stage of a data science problem pipeline
1. Accessing and Exploring Data
The first step in performing data analytics is to access the wealth of available data to explore patterns and develop deeper insights. From a single integrated environment, MATLAB helps you access data from a wide variety of sources and formats like different databases, CSV, audio, video etc
2. Preprocessing and Data Munging
When working with data from numerous sources and repositories, engineers and scientists need to preprocess and prepare data before developing predictive models. For example, data might have missing values or erroneous values, or it might use different timestamp formats. MATLAB helps you simplify what might otherwise be time-consuming tasks such as cleaning data, handling missing data, removing noise from the data, dimensionality reduction, feature extraction and domain analysis such as videos/audios.
3. Developing Predictive Models
Prototype and build predictive models directly from data to forecast and predict the probabilities of future outcomes. You can compare machine learning approaches such as logistic regression, classification trees, support vector machines, and ensemble methods, and use model refinement and reduction tools to create an accurate model that best captures the predictive power of your data. Use flexible tools for processing financial, signal, image, video, and mapping data to create analytics for a variety of fields within the same development environment.
4. Integrating Analytics with Systems
Integrate analytics developed in MATLAB into production IT environments without having to recode or create custom infrastructure. MATLAB analytics can be packaged as deployable components compatible with a wide range of development environments such as Java, Microsoft .NET, Excel, Python, and C/C++. You can share standalone MATLAB applications or run MATLAB analytics as a part of the web, database, desktop, and enterprise applications. For low latency and scalable production applications, you can manage MATLAB analytics running as a centralized service that is callable from many diverse applications.
People these days use MATLAB only when they need to create a quick prototype and then for doing trial and error for validating a fresh concept. The real implementation will never be made with MATLAB but with python, c++ or a similar language. In my opinion MATLAB and python (or python libs) serve for different purposes. Scripting is just one feature out of thousands of features in MATLAB but it is the only feature in python. People use both python and MATLAB scripts where in some other faculties people rely on only MATLAB toolboxes with zero scripting. Hence both python and MATLAB will exist in future but most probably the usage of MATLAB “outside” may be reduced. MATLAB will exist until we have a better alternative of it.
Summary
MATLAB provides a lot of inbuilt utilities which one can directly apply in data science. Furthermore, MATLAB today finds it’s heavy usage in the field of academics and research. Although languages like R and Python are dominating data science worldwide, they are no way near to the simplicity level which MATLAB has to offer. Also, MATLAB will go a long way in the field of data science in the years to come. Additionally, learning MATLAB will be a great bonus for those who are willing to pursue a career in research!
Also, follow this link, if you are looking to learn more about data science online!