The boundaries of the enterprise are becoming diffused. You have data on the network, on the endpoint, and on the cloud. Enabling visibility into your data flows is a critical first step to understanding which data is at risk for theft or misuse. You need to know what data you have, where it’s located, and why that data exists in order to properly protect it. This is where data discovery and data classification come into play.
Data Discovery is an important foundation to gain that knowledge of the what, where, and why of your data. Data Classification allows you to create a scalable security solution. Such solutions as file tagging can be used across platforms from Windows to Mac and also enables you to tag files across the endpoint, network and cloud. This, in turn, gives you visibility into data across all of your infrastructures so you can apply the appropriate policies. Hence,
What is Amazon EMR and Apache Atlas
Amazon EMR is a managed cluster platform that simplifies running big data frameworks, such as Apache Hadoop and Apache Spark, on AWS to process and analyze vast amounts of data. By using these frameworks and related open-source projects, such as Apache Hive and Apache Pig, you can process data for analytics purposes and business intelligence workloads. Additionally, you can use Amazon EMR to transform and move large amounts of data into and out of other AWS data stores and databases, such as Amazon Simple Storage Service (Amazon S3) and Amazon DynamoDB.
Apache Atlas is the one-stop solution for data governance and metadata management on enterprise Hadoop clusters. Atlas has a scalable and extensible architecture which can plug into many Hadoop components to manage their metadata in a central repository. In this blog, we are going to look on one such data discovery and classification tool i.e Apache Atlas. For further use, we will be using Apache Atlas on Amazon EMR. Let us look at more features of Apache Atlas at our disposal!
Apache Atlas Features
1. Centralised Metadata Store
Atlas provides true visibility in Hadoop. By using the native connector to Hadoop components, Atlas provides technical and operational tracking enriched by business taxonomical metadata. Atlas facilitates easy exchange of metadata by enabling any metadata consumer to share a common metadata store that facilitates interoperability across many metadata producers
2. Data Classification
Ability to dynamically create classifications — like pii, expires_on, data_quality. Classifications can include attributes — like an expiry_date attribute in EXPIRES_ON classification. Entities can be associated with multiple classifications, enabling easier discovery and security enforcement. Propagation of classifications via lineage — automatically ensures that classifications follow the data as it goes through various processing.
3. Data lifecycle Management
It leverages existing investment in Apache Falcon with a focus on provenance, multi-cluster replication, data set retention and eviction, late data handling, and automation.
4. Centralised Security
Fine-grained security for metadata access, enabling controls on access to entity instances and operations like add/update/to remove classifications. Integration with Apache Ranger enables authorization/data-masking on data access based on classifications associated with entities in Apache Atlas. Integration with HDP security that enables you to establish global security policies based on data classifications and that leverages Apache Ranger plug-in architecture for security policy enforcement.
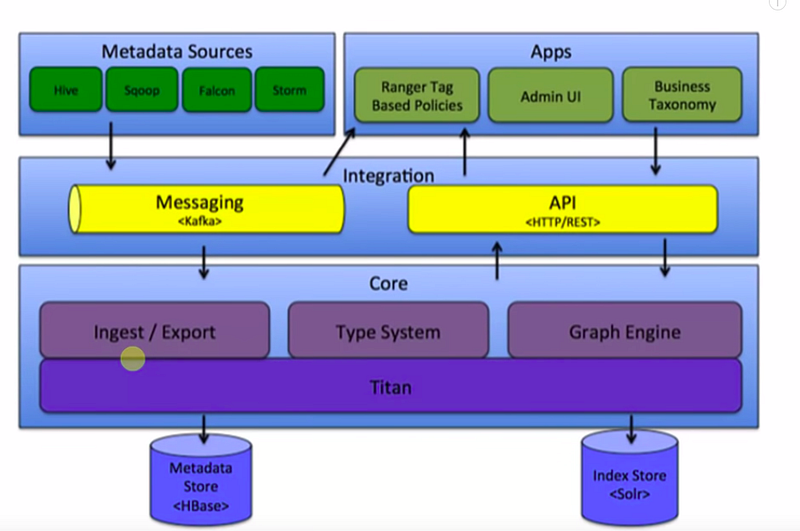
The Architecture of Atlas
This is the basic structure of how this Atlas work. It has got a core component for ingestion and export. In the back-end, it’s using the HBase database for metadata store. It also requires a solar okay that is for index and again the between the different components, the message passing is through Kafka. It can connect Atlas with REST API calls. Also, we have an admin console to manage and monitor all the operations. So, this is a core structure of Atlas and as we know now that it requires HBase hence before we do the installation of Atlas so we need to have a working HBase instance running. Also, we need a SOLAR incensed.
Amazon EMR–Apache Atlas Workflow
To demonstrate the functionality of Apache Atlas, we will be doing the following in this post:
Launch an Amazon EMR cluster using the AWS CLI or AWS Cloud Formation
View the data lineage of a hive table
Create a classification
Discover metadata using the Atlas domain-specific language
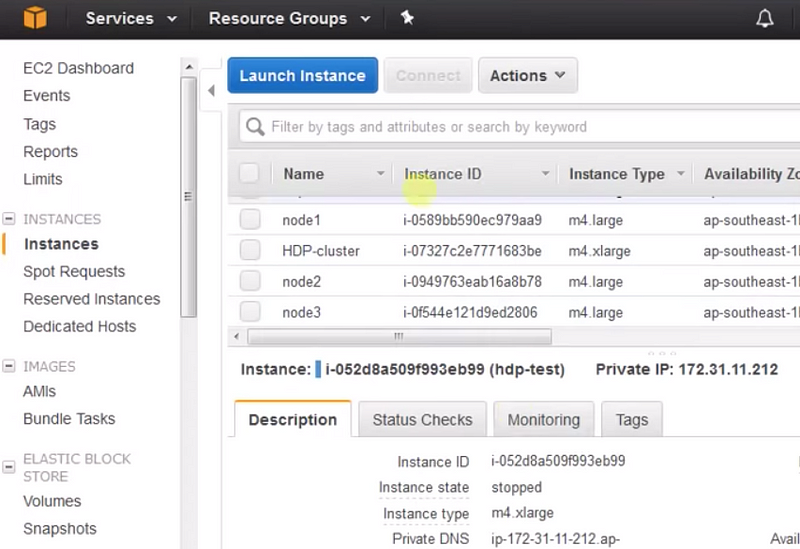
Step 1: Launching Amazon EMR and Atlas
Now, we will be looking into running atlas on Amazon EMR. I have one cluster running on Amazon AWS as a single node instance I have installed Atlas and all its pre-required components like HBase and Kafka beforehand.
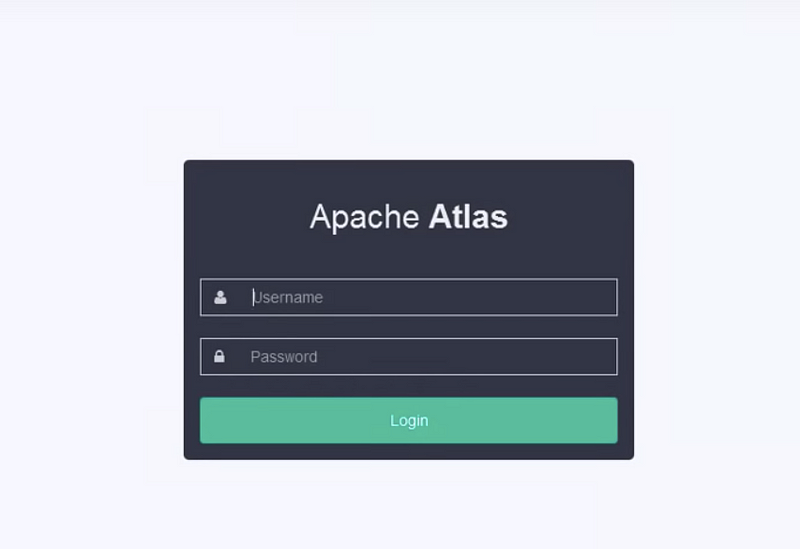
Now, we can open Atlas window by clicking Atlas. Default credentials are admin as username and admin as password. Once you are able to log in successfully, you will be on Atlas page
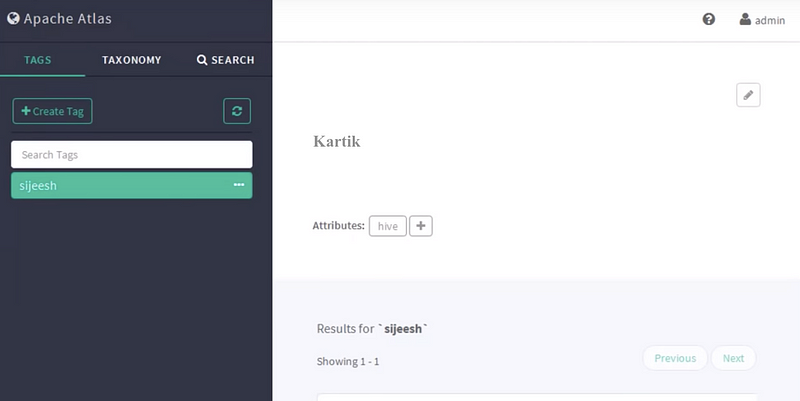
Once, we are logged into Atlas, we can see a couple of tabs available right in front. They are tags, taxonomy and search.
The tag is nothing but a way of grouping certain objects say for example we have PII tag (personally identified information). We can add this tag to certain databases tables or column wherever we need it. Through tags, by using a Ranger, we can control the access of these objects
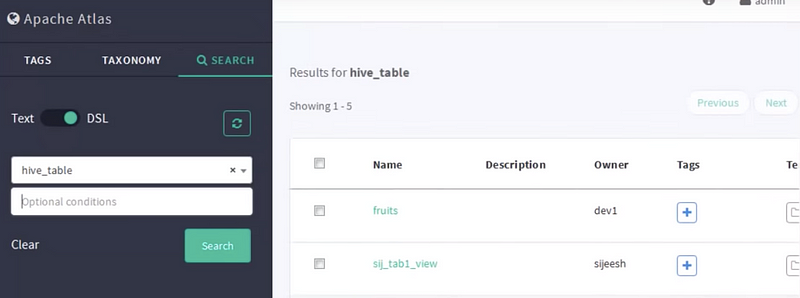
In the search page, we have two options text-based search or DSL. DSL stands for a domain-specific language. It is similar to SQL kind of a query. You can use similar queries and get the details. By default, there are a lot of data sources you can connect to. We will select hive DB here. Once selected, it will show all the hive databases available. Furthermore, we can create a few more databases which will get listed here.
Step 2: Viewing Data Lineage
Data lineage is defined as a data life cycle that conveys data origin and where data moves over time. In Apache Hive, if I create a table (TableA) and then insert data (from another table TableB), the data lineage will display TableA as the target and Table B as the source/origin. These two tables are linked together by a process “insert into Table..”, allowing a user to understand the data life cycle. In a Hadoop ecosystem, Apache Atlas contains the data lineage for various systems like Apache Hive, Apache Falcon and Apache Sqoop.
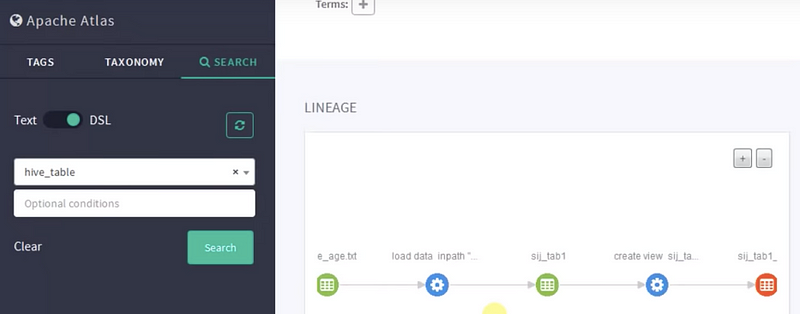
Data lineage is one of the most important features of Apache Atlas. If we click any table or view the table, we can see how the data is flowing. In simple terms, we will get a history of data flow.
In the above pic, we have an initial file. I created a table on Hive and loaded the values into it from a text file. We can easily see this data upload process in the first two nodes. After the data load, we placed all the data into the table “sij” underscore. After that, we made a view of that table.
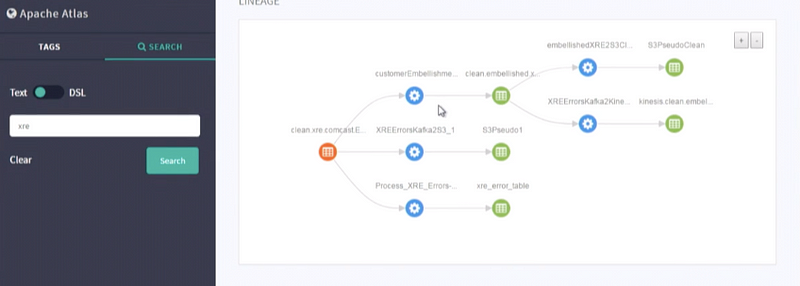
You can see a much more complex data lineage in the image below
In short, this is a data lineage which Apache atlas provides us and this is how you can get the lineage.
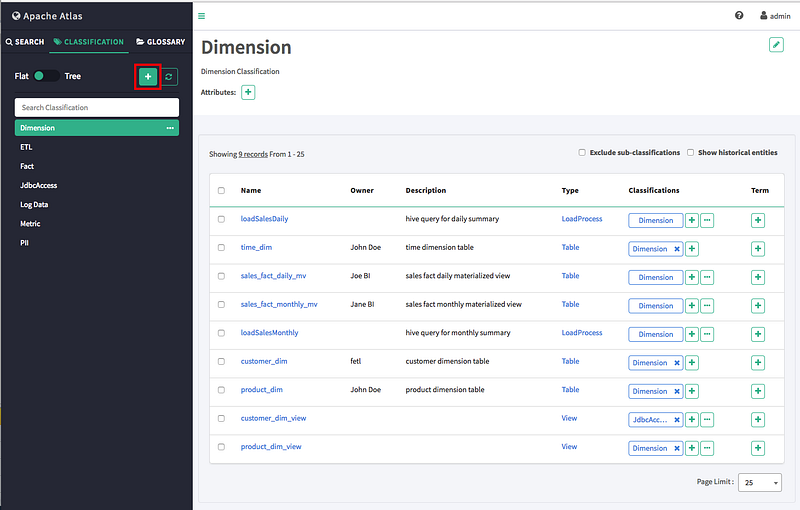
Step 3: Creating a Classification
Classification propagation enables classifications associated with an entity to be automatically associated with other related entities of the entity. This is very useful in dealing with scenarios where a dataset derives its data from other datasets — like a table loaded with data in a file, a report generated from a table/view, etc. For example, when a table is classified as “PII”, tables or views that derive data from this table (via CTAS or ‘create view’ operation) will be automatically classified as “PII”.
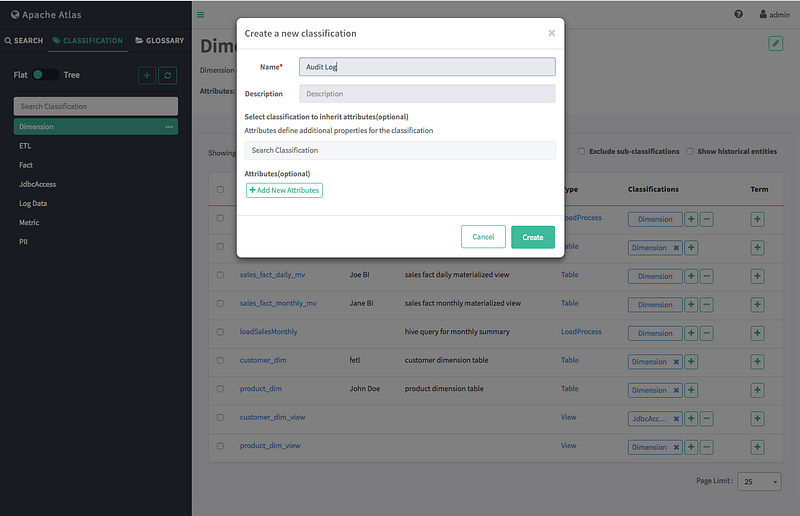
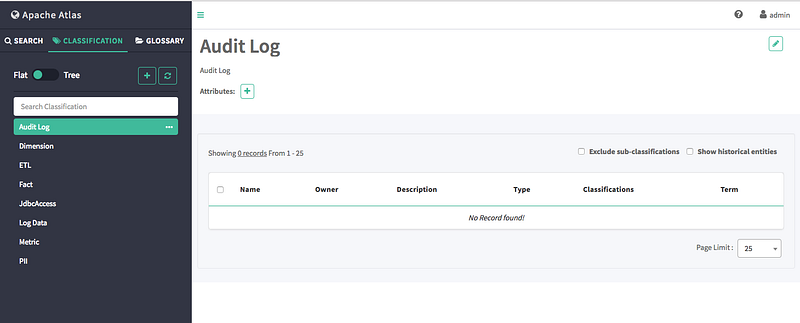
On the Atlas web UI, click CLASSIFICATION, then click the + icon.
On the “Create a new classification” pop-up, type in a name and an optional description for the classification. You can use the Select classifications to inherit attributes box to inherit attributes from other classifications. Click Add New Attributes to add one or more new attributes to the classification. Click Create to create the new classification.
The new classification appears in the Classifications list.
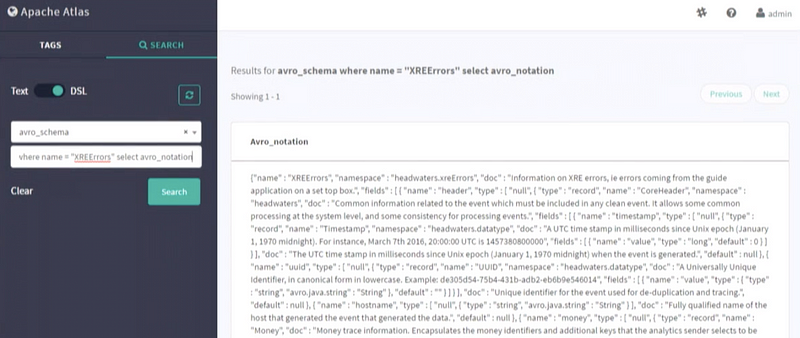
Step 4: Using DSL for Discovering Metadata
Atlas DSL (Domain-Specific Language) is a SQL like a query language that enables you to search metadata using complex queries. In the search tab, you have two options of searching through the databases. One is normal text search and the other is DSL search.
After selecting the DSL search, we can use SQL like queries to extract information out from the tables present in our HIVE database. In the optional, conditions input we can write our SQL queries. We wrote one such query here to extract all the error logs in a specific format. In the image below, you can see results
Summary
In this article, we focused on Apache Atlas as an example to explain and demonstrate metadata management in enterprise governance. We had a look at important topics like data lineage, data discovery, and classification. Apache Atlas is one of the prime tools handling all the metadata management tasks and has a lot of future prospects.
Follow this link, if you are looking to learn more about data science online!
Good data management practices are essential for ensuring that research data are of high quality, findable, accessible and have high validity. You can then share data ensuring their sustainability and accessibility in the long-term, for new research and policy or to replicate and validate existing research and policy. It is important that researchers extend these practices to their work with all types of data, be it big (large or complex) data or smaller, more ‘curatable’ datasets.
In this blog, we are going to understand about the data curation. Furthermore, we will be looking into many other advantages which data curation will bring to the big data table.
What is Data Curation?
Curation is the end-to-end process of creating good data through the identification and formation of resources with long-term value. In information technology, it refers mainly to the management of data throughout its lifecycle, from creation and initial storage to the time when it is archived for future research and analysis, or becomes obsolete and is deleted. The goal of data curation in the enterprise is twofold: to ensure compliance and that data can be retrieved for future research or reuse
Why Do You Need Data Curation?
Organizations invest heavily in big data analytics — $44 billion in 2014 alone, according to Gartner; yet, studies show that most organizations use only about 10% of their collected data, data that remains scattered in silos and varied sources across the organization. With data volumes growing exponentially, along with the increasing variety and heterogeneity of data sources, getting the data you need ready for analysis has become a costly and time-consuming process. Multiple data sets from different sources must first be catalogued and connected before they can be used by various analytics tools. Duplicate data and blank fields need to be eliminated, misspellings fixed, columns split or reshaped, and data need to be enriched with data from additional or third party sources to provide more context.
Effective Machine Learning
Machine Learning algorithms have made great strides towards understanding the consumer space. AI consisting of “neural networks” collaborate, and can use Deep Learning to recognize patterns. However, Humans need to intervene, at least initially, to direct algorithmic behavior towards effective learning. Curations are about where the humans can actually add their knowledge to what the machine has automated. This results in prepping for intelligent self-service processes, setting up organizations up for insights.
Dealing with Data Swamps
A Data Lake strategy allows users to easily access raw data, to consider multiple data attributes at once, and the flexibility to ask ambiguous business driven questions. But Data Lakes can end up Data Swamps where finding business value becomes like a quest to find the Holy Grail. Such Data swamps minus well be a Data graveyard. Well data curation here can save your data lakes from becoming the data yards
Ensuring Data Quality
Data Curators clean and undertake actions to ensure the long undertake actions to ensure the long-term preservation and retention of the authoritative nature of digital objects.
Steps in Data Curation
Data curation is the process of turning independently created data sources (structured and semi-structured data) into unified data sets ready for analytics, using domain experts to guide the process. It involves:
1. Identifying
One needs to identify different data sources of interest (whether from inside or outside the enterprise) before they start working on a problem statement. Identification of the dataset is as important a thing as solving a problem. Many people underestimate the value of data identification. But, when one does data identification the right way, one can save on a lot of time wastage which can happen while optimizing the solution of the problem
2. Cleaning
Once you have some data at hand, one needs to clean the data. The incoming data may have a lot of anomalies like spelling errors, missing values, improper entries etc. Most of the data is always dirty and you need to clean it before you can start working with it. Cleaning data is one of the most important tasks under data curation. There is almost 200% value addition once data is in the right format
3. Transforming
Data transformation is the process of converting data or information from one format to another, usually from the format of a source system into the required format of a new destination system. The usual process involves converting documents, but data conversions sometimes involve the conversion of a program from one computer language to another to enable the program to run on a different platform. The usual reason for this data migration is the adoption of a new system that’s totally different from the previous one. Data curation also takes care of the data transformation
The more data you need to curate for analytics and other business purposes, the more costly and complex curation becomes — mostly because humans (domain experts, or data owners) aren’t scalable. As such, most enterprises are “tearing their hair out” as they try to cope with data curation at scale.
Roles of a Data Curator
In practice, data curation is more concerned with maintaining and managing the metadata rather than the database itself and, to that end, a large part of the process of data curation revolves around ingesting metadata such as schema, table and column popularity, usage popularity, top joins/filters/queries. Data curators not only create, manage, and maintain data, but may also determine best practices for working with that data. They often present the data in a visual format such as a chart, dashboard or report.
Data curation starts with the “data set.” These data sets are the atoms of data curation. Determining which of these data sets are the most useful or relevant is the job of the data curator. Being able to present the data in an effective manner is also extremely important. While some rules of thumb and best practices apply, the data curator must make an educated decision about which data assets are appropriate to use.
It’s important to know the context of the data before it can be trusted. Data curation uses such arbiters of modern taste as lists, popularity rankings, annotations, relevance feeds, comments, articles and the upvoting or downvoting of data assets to determine their relevancy.
How to Start with Data Curation?
First, companies can inject additional data assessments into their reviews of data with end users that evaluate how data can be used or redirected. One way this can be done is by making data retention reviews a collaborative process across business functions. The collaboration enables users who ordinarily wouldn’t be exposed to some types of data to evaluate if there are ways that this data can be plugged in and used in their own departmental analytics processes.
Second, IT and the business should articulate rules governing data purges. Presently, there is a fear of discarding any data, no matter how useless.
Third, companies should consider adding a data curator, which is a librarian-like curation function, to their big data and analytics staffs.
Summary
Data sets are reusable components — anyone conducting analysis should share and expect data sets that they create to be re-used. Re-usability is key to self-service at scale. Companies such as GoDaddy and eBay have already embraced this approach to harvesting and distributing data for re-use, allowing any user to become a curator of data knowledge and resulting in higher productivity.
Data curation observes the use of data, focusing on how context, narrative, and meaning can be collected around a reusable data set. It creates trust in data by tracking the social network and social bonds between users of data. By employing lists, popularity rankings, annotations, relevance feeds, comments, articles and the upvoting or downvoting of data assets, curation takes organizations beyond data documentation to creating trust in data across the enterprise.
Follow this link, if you are looking to learn more about data science online!
Apache Spark has become one of the most popular tools for running analytics jobs. This popularity is due to its ease of use, fast performance, utilization of memory and disk, and built-in fault tolerance. These features strongly correlate with the concepts of cloud computing, where instances can be disposable and ephemeral.
In this lecture, we’re going to run our spark application on Amazon EMR cluster. Also, we’re going to run spark application on top of the Hadoop cluster and we’ll put the input data source into the s3. Furthermore, you might want to ask why we need to save our input source file into s3 instead of local disk this is because in the real world we want to make sure that our data is coming from some distributed file system that can be accessed by every node on our spark cluster.
What is Amazon EMR
EMR stands for elastic Map Reduce. Amazon EMR cluster provides up managed Hadoop framework that makes it easy fast and cost-effective to process vast amounts of data across dynamically scalable Amazon ec2 instances. Also, we can also run other popular distributed frameworks such as Apache spark and HBase in Amazon EMR and interact with data and other AWS data stores such as Amazon s3 and Amazon DynamoDB.
In other words, Amazon EMR is a managed cluster platform that simplifies running big data frameworks, such as Apache Hadoop and Apache Spark, on AWS to process and analyze vast amounts of data. By using these frameworks and related open-source projects, such as Apache Hive and Apache Pig, you can process data for analytics purposes and business intelligence workloads
Our Goal
Our goal is to parse a couple of log files amounting to several thousands of records. This will be done using a hive script/spark program. An SQL table will be created with this structure then the file will be parsed based on this regular expression. Finally, the query will output the number of total requests per operating system
Processing Pipeline
Before diving into the task, let us set up a small pipeline to achieve our goal.
Setting up EMR clusters: We will create an EMR cluster first running different EC2 instances. These clusters will have the capability of providing a scalable and distributed platform for running our code to process big data
Attaching a Data Source
Setting up the Runner Task
Viewing Results and Terminating the EMR Cluster
Step 1: Creating an EMR Cluster
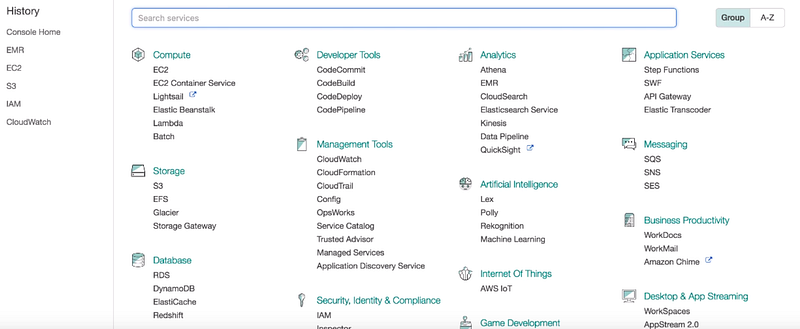
You need to go to the AWS management console. After then, click services on the top left. Then you need to select EMR.
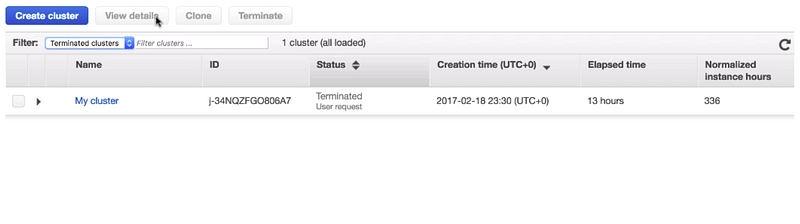
Now we’re at the EMR page. You need to click create a cluster.
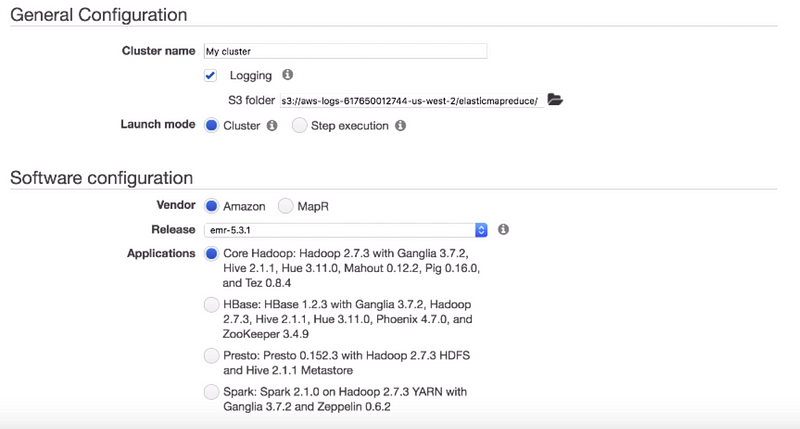
We can leave the cluster name as default. There are two launch modes i.e cluster mode and step execution. With cluster mode, EMR will create a cluster with a set of specified applications. You can add steps to the cluster. After it’s launched, the cluster continues running until you terminate it with stop execution. In our case, we want to install SPARK on top of the Hadoop cluster and we don’t want the cluster to terminate automatically after the job is done so we choose the cluster mode.
This vendor option sets the vendor from which you want to select the software release and applications for your cluster. This release option specifies the software and Amazon EMR platform components to install on the cluster. Amazon EMR uses the release to initialize the Amazon ec2 instances on which your cluster runs. The latest release label is selected by default. We will leave it as default. The application option determines the applications to install on your cluster. Here, we want to install SPARK on top of it.
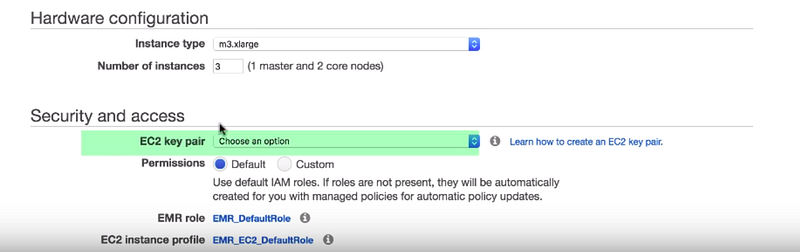
The instant type option determines the Amazon ec2 instance type that Amazon EMR initializes for the instances that run in your cluster. We will use the default. The ec2 key pair option specifies the Amazon ec2 key pair to use when connecting to the nodes in your cluster using SSH. if we do not select the key pair you cannot connect to the cluster. For the rest of the permissions, we go with the default options. After that, we click to create a cluster to start the provisioning now as you see the cluster is in starting state which means the cluster is been provisioned this process takes about 10 to 15 minutes to complete after the cluster is successfully created the state will turn from starting to waiting
Step 2: Preparing Datasource
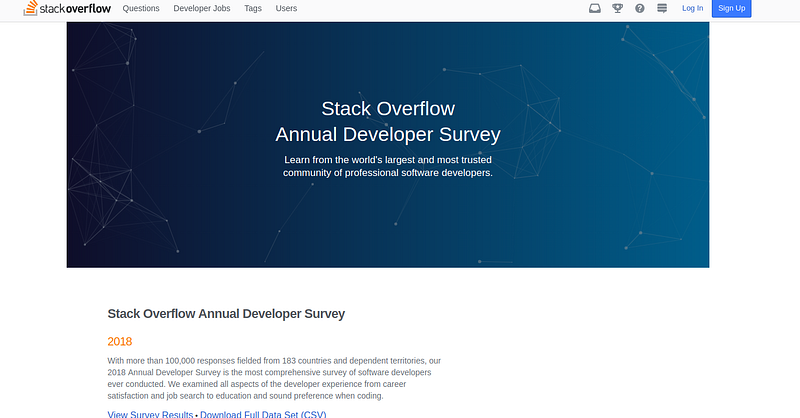
Next, let’s prepare our input data source. We will be using the StackOverflow survey data for this demo. You can find it here. Since we’re going to run our SPARK application on a much large cluster on AWS we can analyze the full stack overflow server data source.
Here on stack overflow research page, we can download data source. After the download is complete, you see the full stack overflow server data source is in CSV format. Next, we’ll be uploading this file to s3.
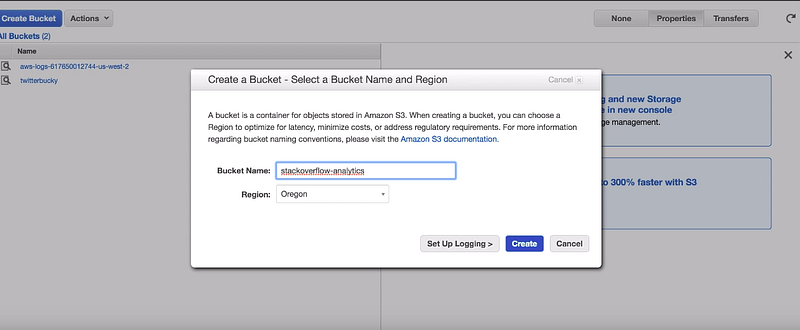
You need to log into the AWS management console again and select s3. Let’s create a new s3 bucket for our spark job. A bucket is a logical unit of storage in s3. Objects are created under buckets. Here, we name our s3 bucket StackOverflow — analytics and then click create.
Now we can just select the newly created bucket name then click upload. After the uploading is complete we can see the CSV file appears under the bucket.
Step 3: Setting up the task
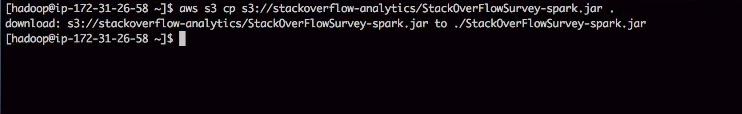
Since data source is ready on s3 let’s login into the spark master machine via SSH. You can find the ssh command by clicking the SSH link under our cluster page. Copy the SSH command and paste it into a terminal. Furthermore, make sure there is an ec2 private key file at the path to the private key file.
Let’s fetch the jar file from s3 to the master machine here for execution. We run AWS s3 CP command which can copy files from or to s3 then supply the source file path which is the s3 file path.
Now we can just run sparks emit and put the jar file name as an argument and hit enter.
Step 4: Terminating the clusters
By running it, we get all the job outputs now we have seen how to run our spark application on a remote cluster.
Make sure you delete all the files from s3 and terminate your EMR cluster if you don’t need them anymore otherwise it would cost money that’s it
Summary
Amazon EC2 Spot Instances offer spare compute capacity available in the AWS Cloud at steep discounts compared to On-Demand prices. EC2 can interrupt Spot Instances with two minutes of notification when EC2 needs the capacity back. You can use Spot Instances for various fault-tolerant and flexible applications. Some examples are analytics, containerized workloads, high-performance computing (HPC), stateless web servers, rendering, CI/CD, and other test and development workloads.
Amazon EMR provides a managed Hadoop framework that makes it easy, fast, and cost-effective to process vast amounts of data using EC2 instances. When using Amazon EMR, you don’t need to worry about installing, upgrading, and maintaining Spark software (or any other tool from the Hadoop framework). You also don’t need to worry about installing and maintaining underlying hardware or operating systems. Instead, you can focus on your business applications and use Amazon EMR to remove the undifferentiated heavy lifting.
Follow this link, if you are looking to learn more about data science online!
The amount of data produced by humans has exploded to unheard-of levels, with nearly 2.5 quintillion bytes of data created daily. With advances in the Internet of Things and mobile technology, data has become a central interest for most organizations. More importantly than simply collecting it, though, is the real need to properly analyze and interpret the data that is being gathered. Also, most businesses collect data from a variety of sources, and each data stream provides signals that ideally come together to form useful insights. However, getting the most out of your data depends on having the right tools to clean it, prepare it, merge it and analyze it properly.
Here are ten of the best analytics tools your company can take advantage of in 2019, so you can get the most value possible from the data you gather.
What is Big Data?
Big data is high-volume, high-velocity and/or high-variety information assets that demand cost-effective, innovative forms of information processing that enable enhanced insight, decision making, and process automation.
Furthermore, Big Data is nothing but any data which is very big to process and produce insights from it. Also, data being too large does not necessarily mean in terms of size only. There are 3 V’s (Volume, Velocity and Veracity) which mostly qualifies any data as Big Data. The volume deals with those terabytes and petabytes of data which is too large to process quickly. Velocity deals with data moving with high velocity. Continuous streaming data is an example of data with velocity and when data is streaming at a very fast rate may be like 10000 of messages in 1 microsecond. Veracity deals with both structured and unstructured data. Data that is unstructured or time-sensitive or simply very large cannot be processed by relational database engines. This type of data requires a different processing approach called big data, which uses massive parallelism on readily-available hardware.
Trending Big Data Tools in 2019
1. Apache Spark
Apache Spark is a fast and general-purpose cluster computing system. It provides high-level APIs in Java, Scala, Python and R, and an optimized engine that supports general execution graphs. It also supports a rich set of higher-level tools including Spark SQL for SQL and structured data processing, MLlib for machine learning, GraphX for graph processing, and Spark Streaming.
Spark is designed to cover a wide range of workloads such as batch applications, iterative algorithms, interactive queries and streaming. Apart from supporting all these workloads in a respective system, it reduces the management burden of maintaining separate tools.
Apache Spark has the following features.
Speed − Spark helps to run an application in Hadoop cluster, up to 100 times faster in memory, and 10 times faster when running on disk. This is possible by reducing the number of reading/write operations to disk. It stores the intermediate processing data in memory.
Supports Multiple languages − Spark provides built-in APIs in Java, Scala, or Python. Therefore, you can write applications in different languages. Spark comes up with 80 high-level operators for interactive querying.
Advanced Analytics − Spark not only supports ‘Map’ and ‘reduce’. It also supports SQL queries, Streaming data, Machine learning (ML), and Graph Algorithms.
2. Apache Kafka
Apache Kafka is a community distributed event streaming platform capable of handling trillions of events a day. Initially conceived as a messaging queue, Kafka is based on an abstraction of a distributed commit log. Since being created and open sourced by LinkedIn in 2011, Kafka has quickly evolved from messaging queue to a full-fledged event streaming platform.
Following are a few benefits of Kafka −
Reliability − Kafka is distributed, partitioned, replicated and fault tolerance
Scalability − Kafka messaging system scales easily without downtime
Durability − Kafka uses Distributed commit log which means messages persists on disk as fast as possible, hence it is durable
Performance − Kafka has high throughput for both publishing and subscribing messages. It maintains stable performance even many TB of messages are stored.
Kafka is very fast and guarantees zero downtime and zero data loss.
3. Flink
Apache Flink is a framework and distributed processing engine for stateful computations over unbounded and bounded data streams. Flink has been designed to run in all common cluster environments, perform computations at in-memory speed and at any scale.
It provides a high-throughput, low-latency streaming engine as well as support for event-time processing and state management. Flink applications are fault-tolerant in the event of machine failure and support exactly-once semantics. Programs can be written in Java, Scala, Python and SQL and are automatically compiled and optimized into dataflow programs that are executed in a cluster or cloud environment. Flink does not provide its own data storage system, but provides data source and sink connectors to systems such as Amazon Kinesis, Apache Kafka, Alluxio, HDFS, Apache Cassandra, and ElasticSearch.
4. Hadoop
The Apache Hadoop software library is a framework that allows for the distributed processing of large data sets across clusters of computers using simple programming models. It is designed to scale up from single servers to thousands of machines, each offering local computation and storage. Rather than rely on hardware to deliver high-availability, the library itself is designed to detect and handle failures at the application layer, so delivering a highly-available service on top of a cluster of computers, each of which may be prone to failures.
Following are the few advantages of using Hadoop:
Hadoop framework allows the user to quickly write and test distributed systems. It is efficient, and it automatic distributes the data and work across the machines and in turn, utilizes the underlying parallelism of the CPU cores
Hadoop does not rely on hardware to provide fault-tolerance and high availability
You can add or remove the cluster dynamically and Hadoop continues to operate without interruption
Another big advantage of Hadoop is that apart from being open source, it is compatible with all the platforms
5. Cassandra
The Apache Cassandra database is the right choice when you need scalability and high availability without compromising performance. Linear scalability and proven fault-tolerance on commodity hardware or cloud infrastructure make it the perfect platform for mission-critical data. Cassandra’s support for replicating across multiple datacenters is best-in-class, providing lower latency for your users and the peace of mind of knowing that you can survive regional outages.
Cassandra has become so popular because of its outstanding technical features. Given below are some of the features of Cassandra:
Elastic Scalability — Cassandra is highly scalable; it allows to add more hardware to accommodate more customers and more data as per requirement
Always on Architecture — Cassandra has no single point of failure and it is continuously available for business-critical applications that cannot afford a failure
Fast linear-scale Performance — Cassandra is linearly scalable, i.e., it increases your throughput as you increase the number of nodes in the cluster. Therefore it maintains a quick response time
Flexible Data Storage — Cassandra accommodates all possible data formats including: structured, semi-structured, and unstructured. It can dynamically accommodate changes to your data structures according to your need
Easy Data Distribution — Cassandra provides the flexibility to distribute data where you need by replicating data across multiple data centers
Transaction Support — Cassandra supports properties like Atomicity, Consistency, Isolation, and Durability (ACID)
Fast Writes — Cassandra was designed to run on cheap commodity hardware. It performs blazingly fast writes and can store hundreds of terabytes of data, without sacrificing the read efficiency
6. Apache Storm
Apache Storm is a free and open source distributed real-time computation system. Storm makes it easy to reliably process unbounded streams of data, doing for real-time processing what Hadoop did for batch processing. The storm is simple, can be used with any programming language, and is a lot of fun to use!
It has many use cases: real-time analytics, online machine learning, continuous computation, distributed RPC, ETL, and more. The storm is fast: a benchmark clocked it at over a million tuples processed per second per node. It is scalable, fault-tolerant guarantees your data will be processed, and is easy to set up and operate.
7. RapidMiner
RapidMiner is a data science software platform by the company of the same name that provides an integrated environment for data preparation, machine learning, deep learning, text mining, and predictive analytics.
8. Graph Databases (Neo4J and GraphX)
Graph databases are NoSQL databases which use the graph data model comprised of vertices, which is an entity such as a person, place, object or relevant piece of data and edges, which represent the relationship between two nodes.
They are particularly helpful because they highlight the links and relationships between relevant data similarly to how we do so ourselves.
Even though graph databases are awesome, they’re not enough on their own.
Advanced second-generation NoSQL products like OrientDB, Neo4j are the future. The modern multi-model database provides more functionality and flexibility while being powerful enough to replace traditional DBMSs.
9. Elastic Search
Elasticsearch is a search engine based on the Lucene library. It provides a distributed, multitenant-capable full-text search engine with an HTTP web interface and schema-free JSON documents.
Following are advantages of using elastic search:
Elasticsearch is over Java, which makes it compatible on almost every platform.
It is real time, in other words, after one second the added document is searchable in this engine.
Also, it is distributed, which makes it easy to scale and integrate into any big organization.
Creating full backups are easy by using the concept of the gateway, which is present in Elasticsearch.
Handling multi-tenancy is very easy in Elasticsearch
Elasticsearch uses JSON objects as responses, which makes it possible to invoke the Elasticsearch server with a large number of different programming languages.
Elasticsearch supports almost every document type except those that do not support text rendering.
10. Tableau
Exploring and analyzing big data translates information into insight. However, the massive scale, growth and variety of data are simply too much for traditional databases to handle. For this reason, businesses are turning towards technologies such as Hadoop, Spark and NoSQL databases to meet their rapidly evolving data needs. Tableau works closely with the leaders in this space to support any platform that our customers choose. Tableau lets you find that value in your company’s data and existing investments in those technologies so that your company gets the most out of its data. From manufacturing to marketing, finance to aviation– Tableau helps businesses see and understand Big Data.
Summary
Understanding your company’s data is a vital concern. Deploying any of the tools listed above can position your business for long-term success by focusing on areas of achievement and improvement.
Follow this link, if you are looking to learn more about data science online!
Setting up a new business? Or trying to grow an existing one? No matter which one it is, web scraping is the best way to collect data for growing your business today. It will help you get valuable insights, and information about your latest competition, no matter what you deal in – products or services. Although web scraping has been going on for quite some time, it has never been as heavily used, or as reliable as it is today.
In this blog, we will learn about web scraping. Furthermore, we will also learn about making our own web scraper and collect data from the websites. We will implement the scraper in python using the Beautiful Soup library. So before we jump into web scraping, let us first understand what web scraping actually is!
What is Web Scraping?
Web scraping is the process of extracting data from websites. All the job is carried out by a piece of code which is called a “scraper”. First, it sends a “GET” query to a specific website. Then, it parses an HTML document based on the received result. After it’s done, the scraper searches for the data you need within the document, and, finally, convert it into the specified format.
Web-scraping is an important technique, frequently employed in a lot of different contexts, especially data science and data mining. Python is largely considered the go-to language for web-scraping, the reason being the batteries-included nature of Python. With Python, you can create a simple scraping script in about 15 minutes and in under 100 lines of code. So regardless of usage, web-scraping is a skill that every Python programmer must have under his belt.
Uses of Web Scraping:
These include article extraction for websites that curate content, business listings extraction for companies that build databases of leads, and many different types of data extraction, sometimes called data mining. For example, one popular and sometimes controversial use of a web scraper is for pulling prices off of airlines to publish on airfare comparison sites.
Scraping Goal
In this blog, we will try to learn about web scraping by implementing it ourselves. Our goal is simple here. We have a blog section on our website. What we want is fairly simple. We need the data containing blog title, date, and the author name.
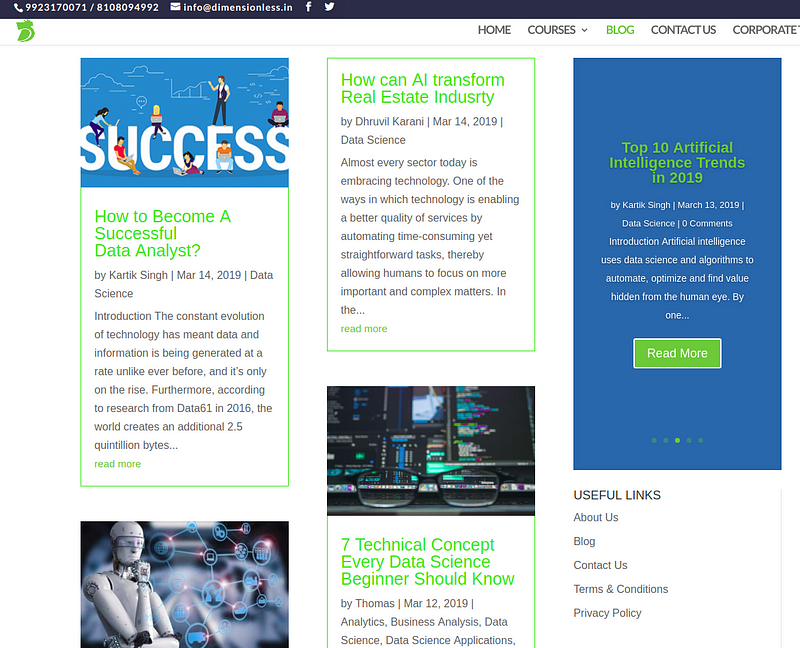
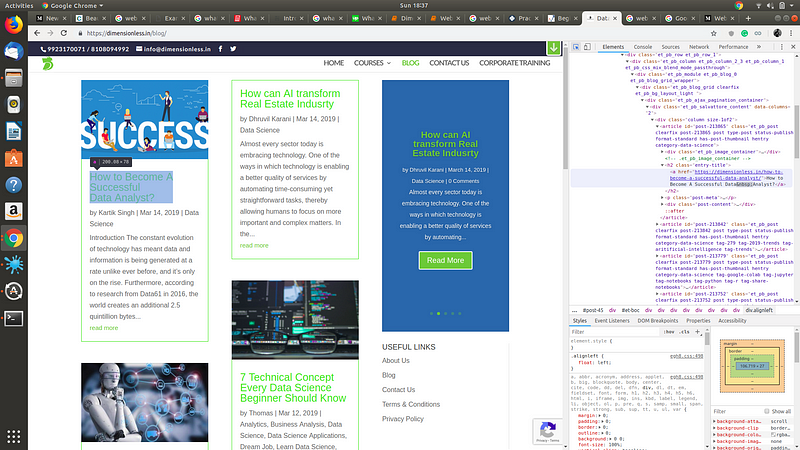
The target page looks like one below. You can visit the page through the following link.
Our target page for scraping
The Web Scraping Pipeline:
Before we directly jump to web scraping, let us have a look at the basic pipeline for this. We can understand web-scraping as a pipeline containing 3 components:
Downloading: Downloading the HTML web-page
Parsing: Parsing the HTML and retrieving data we’re interested in
Storing: Storing the retrieved data in our local machine in a specific format
In the next section, we will implement a web scraper to get all the blog names for us using python. We will use Beautiful Soup library in python for scraping web pages. One by one, we will go through the stages in the scraping pipeline. Full code will be present in the end section.
Implementing a Web Scraper using Beautiful Soup:
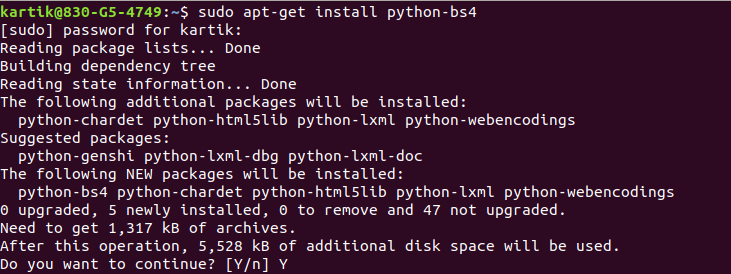
First of all, we need to install Beautiful Soup library in our system. To install it, you can use the following command
## Using apt-get
sudo apt-get install python-bs4
## Using pip
pip install bs4
Once you run the above command, it will start installing the packages for you.
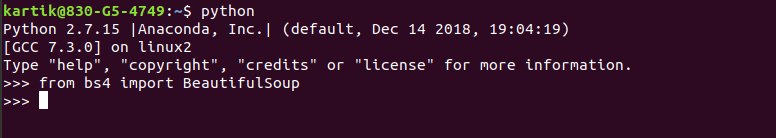
In order to verify the installation, you can try importing the library following way
from bs4 import BeautifulSoup
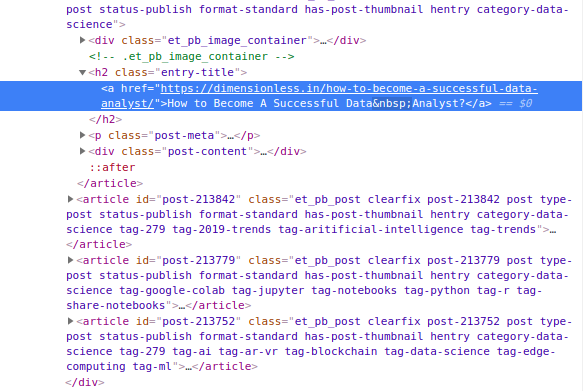
Let us start writing our scraper now. You need to analyze the HTML structure of the target web page. To do so, you can left click and select inspect element option. This will enable you to see the HTML code behind the web page.
With the pen icon button, you can hover over the website to find their code in the source code. For example, to find the HTML code for the author name, hover the mouse over the author name. On the right side, it will highlight for you the location of that code.
Let us dig deeper into the HTML code here.
After hovering over the author name, we can clearly see the HTML code here for the same. All the author names have an H2 tag with class name “entry-title”. We can use this combination of tag and class name to get all the instances where the author name is there. A similar process will happen for the date and the author name.
We can start building our scraper now. First, we need to import all the basic libraries. We can do this by the following code
## For downloading HTML structure
import requests
## For Scraping through HTML
from bs4 import BeautifulSoup
## For visualising data in a table
import pandas as pd
Downloading the Data:
Once we have all the libraries, we start by downloading the HTML code of the target website. Now, we need to mention our target URL. After that, we need to download the HTML content from the target web page. In the end, we will have an object(Beautiful soup compatible) holding the data.
## Mentioning the target url
targetUrl = 'https://dimensionless.in/blog'
## Downloading the HTML content from the target page
r= requests.get(targetUrl)
data=r.text
##Converting the data into a Beautiful Soup compatible object
soup=BeautifulSoup(data)
Parsing the Data:
Once we have the entire HTML content available, we need to search for our specific information in this data. As we saw earlier, we can use the tag type and other identifiers like id or class to extract any specific information.
Upon exploring the code, I was able to find the following identifiers for our target information. You can also try to find out these using inspect elements. Try to analyze that this selection makes sense or doesn’t make sense.
Blog Name — — Tag-”H2″ — — class-”entry-title”
Author Name — — Tag-”span” — — class-”author vcard”
Blog Date — — Tag-”span” — — class-”published”
## Lists for holding the values
blog_names=[]
author_names=[]
blog_dates=[]
## Iterating through all the articles and extracting blog title, author name and blog date
for listing in soup.find_all('article'):
    for blog_name in listing.find('h2', attrs={'class':"entry-title"}):
        blog_names.append(blog_name.text)
    for author_name in listing.find('span', attrs={'class':"author vcard"}):
        author_names.append(author_name.text)
    for blog_date in listing.find('span', attrs={'class':"published"}):
        blog_dates.append(blog_date)
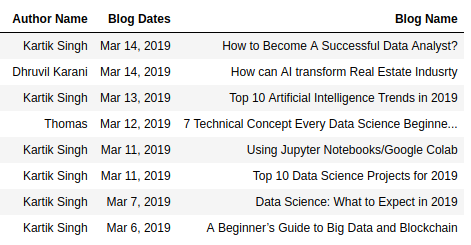
Visualising and Storing Results:
In the previous step, we have collected the data from the website using the code. Now, it is time to see the data. This task is fairly simple. You can use the pandas library available in python to store all the results in a table (data frame). The following code will perform this task for you!
## For downloading HTML structure
import requests
## For Scraping through HTML
from bs4 import BeautifulSoup
## For visualising data in a table
import pandas as pd

## Mentioning the target url
targetUrl = "https://dimensionless.in/blog"
## Downloading the HTML content from the target page
r= requests.get(targetUrl)
data=r.text
##Converting the data into a Beautiful Soup compatible object
soup=BeautifulSoup(data)

## Lists for holding the values
blog_names=[]
author_names=[]
blog_dates=[]

## Iterating through all the articles and extracting blog title, author name and blog date
for listing in soup.find_all('article'):
    for blog_name in listing.find('h2', attrs={'class':"entry-title"}):
        blog_names.append(blog_name.text)
    for author_name in listing.find('span', attrs={'class':"author vcard"}):
        author_names.append(author_name.text)
    for blog_date in listing.find('span', attrs={'class':"published"}):
        blog_dates.append(blog_date)

blogData=pd.DataFrame({"Blog Name":blog_names, "Author Name":author_names, "Blog Dates":blog_dates})
The Advantages of Web Scraping:
The major advantages of web scraping services are:
Inexpensive — Web scraping services provide an essential service at a low cost. It is paramount that data is collected back from websites and analyzed so that the internet functions regularly. Web scraping services do the job in an efficient and budget-friendly manner.
Easy to Implement — Once a web scraping services deploy the proper mechanism to extract data, you are assured that you are not only getting data from a single page but from the entire domain. This means that with just a onetime investment, a lot of data can be collected.
Low Maintenance and Speed– One aspect that is often overlooked when installing new services is the maintenance cost. Long term maintenance costs can cause the project budget to spiral out of control. Thankfully, web scraping technologies need very little to no maintenance over a long period. Another characteristic that must also be mentioned is the speed with which web scraping services do their job. A job that could take a person week is finished in a matter of hours.
Accuracy — The web scraping services are not only fast, but they are also accurate too. Simple errors in data extraction can cause major mistakes later on. Accurate extraction of any type of data is thus very important. In websites that deal in pricing data, sales prices, real estate numbers or any kind of financial data, the accuracy is extremely important.
Summary
In this blog, we learned about scraping web pages in python. We used BeautifulSoup library to perform the scraping for us. Web scraping is one of the most important methods of collecting data online. Let us touch upon a concept that often comes up and confuses most of us when we read about Web scraping: web crawling! So, what is web crawling? Web crawling entails downloading a web page’s data automatically, extracting the hyperlinks on the same and following them. This downloaded data can be organized in an index or a database, using a process called web indexing, to make it easily searchable. How are the two techniques different? In simple terms, you can use web scraping to extract book reviews from the Goodreads website to rate and evaluate books. You can use this data for an array of analytical experiments. On the other hand, one of the most popular applications of a web crawler is to download data from multiple websites and build a search engine. Googlebot is Google’s own web crawler.
Follow this link, if you are looking to learn more about data science online!